Yield on Cost vs. Market Cap Rate: Where the Development Spread Lives

A broker walks a value-add sponsor through a 1970s garden apartment complex on the edge of a growing Sun Belt suburb. The roofs are tired, the kitchens are original, half the units turn over every year because the current owner has never touched them. The GP is not looking at the property the broker is selling. The sponsor is looking at a different property — the one that exists after two years of renovations, higher rents, and a professional management team. The gap between what the building earns today and what it will earn stabilized, measured against what the whole project costs to get there, is the entire investment thesis. There is a single number that captures it. It is called yield on cost. As an individual LP evaluating an offering memorandum, you may have trouble finding it.
Yield on cost is the most important return metric that limited partners rarely ask about. The headline figures in a deck are almost always the projected IRR and the equity multiple, both of which depend on assumptions about a sale that hasn't happened yet. Yield on cost is quieter and harder to fudge. It answers a plainer question: for every dollar this project costs to build or fix and stabilize, how many cents of annual income will it produce? Set that number next to the market cap rate (what a buyer would pay for the same asset already stabilized) and the space between them is where the return is manufactured rather than merely purchased. In other words, this is the performance of the asset generated through quality management and improvements. GPs may refer to this as the development spread, or the “value-add” spread.
What Yield on Cost Measures
Yield on cost is stabilized net operating income divided by total project cost. Both halves of that fraction deserve a careful look, because both are where sponsors get optimistic.
Stabilized NOI is the income the property is expected to produce once the business plan is complete: renovations done, rents marked to market, occupancy normalized, expenses running at an efficient level. It is a forward number, not a current one. The going-in NOI, what the building earns the day it changes hands, is usually much lower, which is the whole point of a value-add deal.
Total project cost is everything it takes to reach that stabilized state. Purchase price, yes, but also (typically):
- The renovation budget
- The soft costs (legal, marketing, etc.)
- The financing costs during the work
- TI/LCs (tenant improvements and leasing commissions) or other leasing costs;
- and a reserve for the inevitable surprise.
A sponsor who quotes yield on cost against purchase price alone, leaving out the capital needed to stabilize, is quoting a number that flatters the deal. The honest denominator is the all-in cost to get the building to the NOI in the numerator.
Divide the two and you get a percentage. A stabilized NOI of $3.5 million on an all-in cost of $50 million is a 7.0% yield on cost. That figure is comparable across deals in a way that IRR is not, because it strips out leverage, hold period, and the guesswork of an exit price. It tells you how productive the project is on an unlevered, all-cash basis at stabilization.
Why the Market Cap Rate Is the Other Half of the Story
A yield on cost of 7.0% means nothing in isolation. It has to be read against what the market will pay for the finished product.
The market cap rate is stabilized NOI divided by price for a comparable asset that is already stabilized — a building someone else already fixed. If similar renovated garden apartments in the same submarket trade at a 5.5% cap rate, then the market is willing to pay roughly $18.18 of price for every dollar of stabilized income. Our sponsor, meanwhile, is creating that same dollar of income for about $14.29 of cost, because a 7.0% yield on cost is the inverse of a 7.0% return per dollar spent. The sponsor builds income cheaper than the market buys it. The 150 basis points between the 7.0% yield on cost and the 5.5% market cap rate is the margin (or the “value-add spread”).
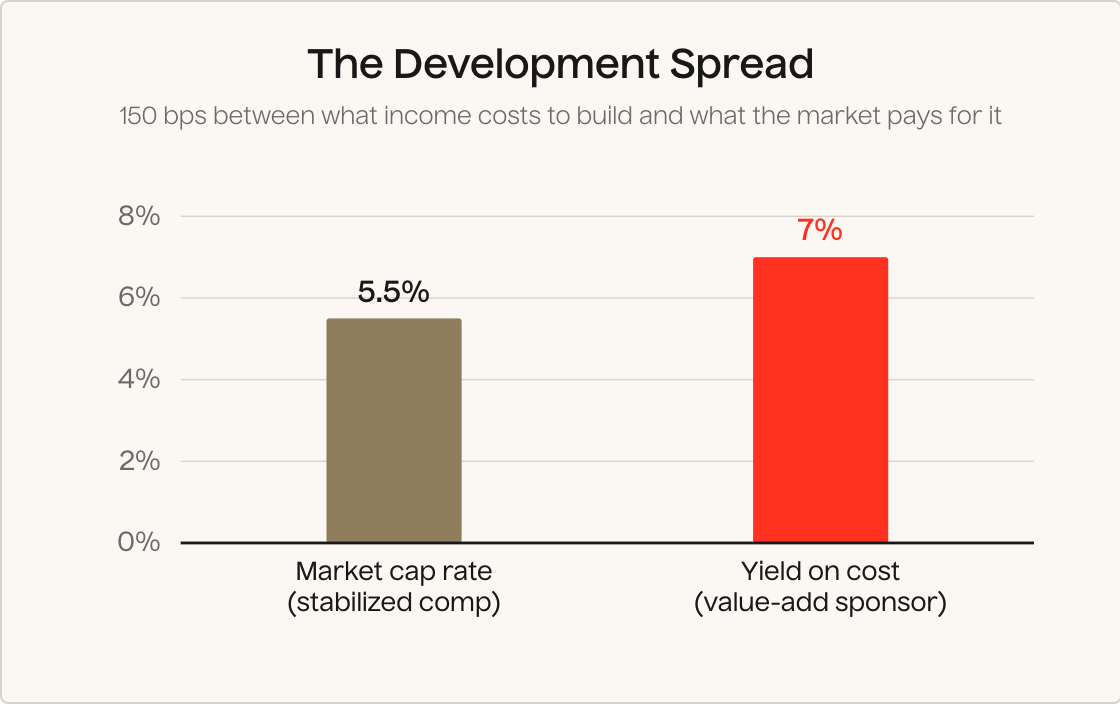
That spread is the reason the deal exists. If the sponsor could only reach a 5.5% yield on cost, matching the market cap rate, there would be no reason to take on two years of construction risk, tenant turnover, and budget uncertainty. The finished building would be worth exactly what it cost to create. All that effort would have produced a market-rate asset at a market-rate price, which is a great deal of work for a coin flip. The spread is the compensation for doing the hard thing, and it is also the cushion that absorbs the things that go wrong. Stabilized yield on cost is put under a microscope during Lightstone’s underwriting process, as light value-add strategies are core to the business.
A Hypothetical Example: How the Spread Becomes Value
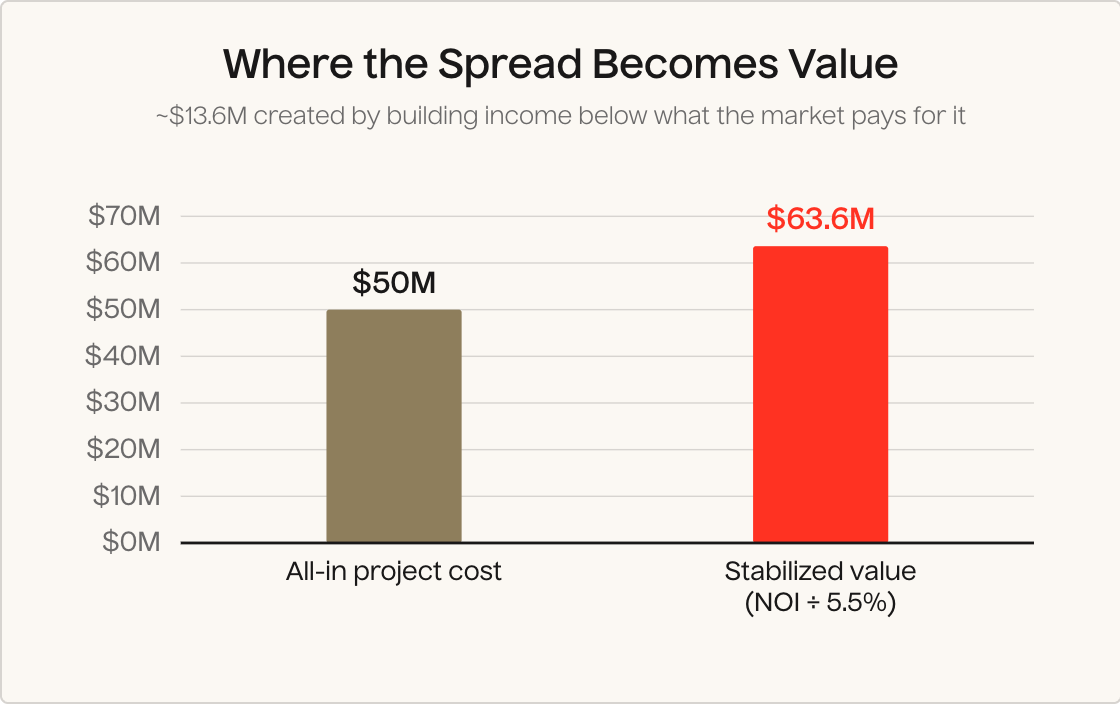
Let’s take a look at some hypothetical numbers to bring this home. Take the illustrative deal above: $50 million all in, a stabilized NOI of $3.5 million, a 7.0% yield on cost. Now apply the market's verdict. At a 5.5% cap rate, a stabilized income stream of $3.5 million is worth about $63.6 million ($3.5 million divided by 0.055).
The project cost $50 million to create. The market values it at $63.6 million once stabilized. The difference, roughly $13.6 million before selling costs, is the value the business plan manufactured. It did not come from the market getting more expensive. It came from the spread between what it cost to produce the income and how the market values that income (i.e. the cap rate).
This is why sophisticated LPs may be inclined to read yield on cost before they read the projected IRR. The IRR folds in leverage, the exact timing of cash flows, and an assumed sale price. Those inputs can be tuned to produce almost any headline; loosen the rent growth assumptions here, move the exit cap assumptions a few BPS, and you have a materially different IRR projection. Yield on cost and the market cap rate are harder to dress up, and the spread between them shows whether there is real value being created or whether the model is leaning on cap rates dynamics, or an overly optimistic sale scenario, carrying the headline return projection.
How an LP Should Read the Spread
Three questions turn yield on cost from a number on a page into a judgment about a deal.
How wide is the spread, and is it wide enough for the risk? A 150-basis-point spread is a reasonable target for a moderate value-add multifamily business plan. Ground-up development, which carries entitlement, construction, and lease-up risk, generally needs more — often 200 basis points or better between the yield on cost and the expected exit cap rate. A thin spread, say 30 basis points, means the sponsor is manufacturing very little margin and could be betting that cap rates will fall to bail out the return. That is a market-timing bet wearing a value-add costume.
What exit cap rate is the spread measured against? The spread is only as honest as the cap rate on the other side of it. If a sponsor assumes an exit cap substantially lower than today's market (cap rates compressing over the hold), the projected spread widens on paper without any operational improvement. A conservative underwriter assumes the exit cap is roughly in line with (or occasionally slightly higher than) the going-in market cap rate, so the return has to come from NOI growth, not from a friendlier market. Ask what exit cap the model uses and compare it to where comparable assets trade now.
Is the stabilized NOI credible? The numerator tells you a lot about how optimistic the underwriting is in a value-add deal. Rent growth assumptions, the pace of renovation, the renovated-unit rent premium, the expense ratio at stabilization — each is a lever, and each can be pushed in the underwriting math. A yield on cost built on a rent premium that no comparable property in the submarket has actually achieved is a yield on cost built on sand.
When the Spread Compresses
A spread on a pro forma is a projection, and unforeseen challenges can muck up the math quickly.
Construction and renovation costs overrun. When the all-in cost climbs, the denominator of yield on cost grows and the yield itself falls. A $50 million budget that becomes $55 million drops a 7.0% yield on cost to about 6.4%, and half the spread is gone before a single unit is renovated above plan.
Exit cap rates expand. The 5.5% assumption that made the finished building worth $63.6 million is not a law of nature. If the market repriced to a 6.0% cap rate by sale, the same $3.5 million of NOI would be worth about $58.3 million rather than $63.6 million. The income did exactly what it was supposed to do, and roughly $5 million of value evaporated anyway, because the environment moved.
Stabilized NOI arrives late or light. If renovated rents land below the premium the model assumed, or the property takes three years to stabilize instead of two, the numerator underperforms and the whole spread thins. The wider the spread the sponsor underwrites, the more of this ordinary trouble the deal can absorb before the LP's return is impaired. That is what the spread is for. It is a margin of safety, not a promise.
The Lightstone Approach
Lightstone underwrites to a spread it believes leaves room for the deal to go wrong, because four decades and multiple cycles has carried hard lessons. Key to the underwriting process, qualitatively and quantitatively, is “what’s the worst that can happen.” A value-add business plan that only works if cap rates fall is not a business plan; it is a bet on the Federal Reserve. The firm's preference is a going-in basis and a stabilized yield on cost that manufacture a real margin over where comparable assets trade today, so the return leans on rent growth and operational improvement rather than on a compliant market. Paired with the 20%-plus of equity Lightstone places in every deal alongside its LPs, the yield-on-cost discipline is a statement about who absorbs the downside when the spread compresses: the sponsor's capital sits in the same stack, exposed to the same math.
The Number Behind the Numbers
The IRR is the number a deck leads with, and it is the number most likely to be tuned to taste. Yield on cost is the number underneath it, closer to the ground, harder to flatter. Read against the market cap rate, it tells you whether a sponsor is building income at a discount to what income costs in the open market, or whether the deal is quietly counting on cap rates to fall so the return arrives without the operator ever having to earn it. The spread is where the return lives. A value-add investor's first job is to find it, size it against the risk, and ask what happens in the worst-case scenario.
Further reading: CBRE U.S. Cap Rate Survey (for prevailing cap-rate levels by asset class and market); RealPage Analytics apartment market data (for submarket rent and occupancy trends); U.S. Bureau of Labor Statistics Producer Price Index for construction materials (for construction-cost inflation context).

Soren Godbersen
Soren Godbersen is Chief Growth Officer at Lightstone DIRECT, where he oversees investor experience, day-to-day operations, marketing, and strategic direction of the group. Previously Godbersen was Chief Growth Officer at EquityMultiple, a category-defining real estate investment platform for accredited investors where he led the Marketing and Investor Relations Teams, helping to grow the firm’s AUM to nearly $1B, and investor network to over 5,000 individual high-net-worth investors. Godbersen holds a Bachelor's of Arts in Economics with Honors from Whitman College.