Learn more about everything Lightstone DIRECT has to offer
Generating magic link...
Understanding Cap Rates: Context, Cycles, and the Real Measure of Value

Cap rates are one of the most referenced metrics in commercial real estate. They’re used to benchmark pricing, evaluate acquisitions, and compare performance across markets and asset classes. They are simple in concept but complex in practice. For investors, understanding what drives cap rates and how they behave through market cycles is essential to making sound investment decisions. Too often, they are interpreted as a standalone indicator of value. In reality, a cap rate tells part of the story but rarely the whole picture.
At Lightstone DIRECT, cap rates serve as a starting point for analysis rather than the final verdict. They help frame how we assess risk, price opportunity, and position assets within their respective markets. But just as a tenant’s lease rate doesn’t capture their overall value to an asset, a cap rate doesn’t capture everything that matters about a deal. It must be interpreted in context, informed by fundamentals, and supported by disciplined underwriting.
What a Cap Rate Really Represents
A cap rate reflects the relationship between a property’s net operating income (NOI) and its market value, or purchase price. It is calculated by dividing the annual NOI by the property’s value. A property generating $1 million in NOI that trades for $20 million has a 5.0% cap rate. In this example, the investor is earning an unlevered yield of 5.0% before financing. Another way to think about it is that a 5.0% cap rate is equivalent to paying a 20x multiple of NOI, similar to a 20x price-to-earnings (P/E) ratio in the stock market.
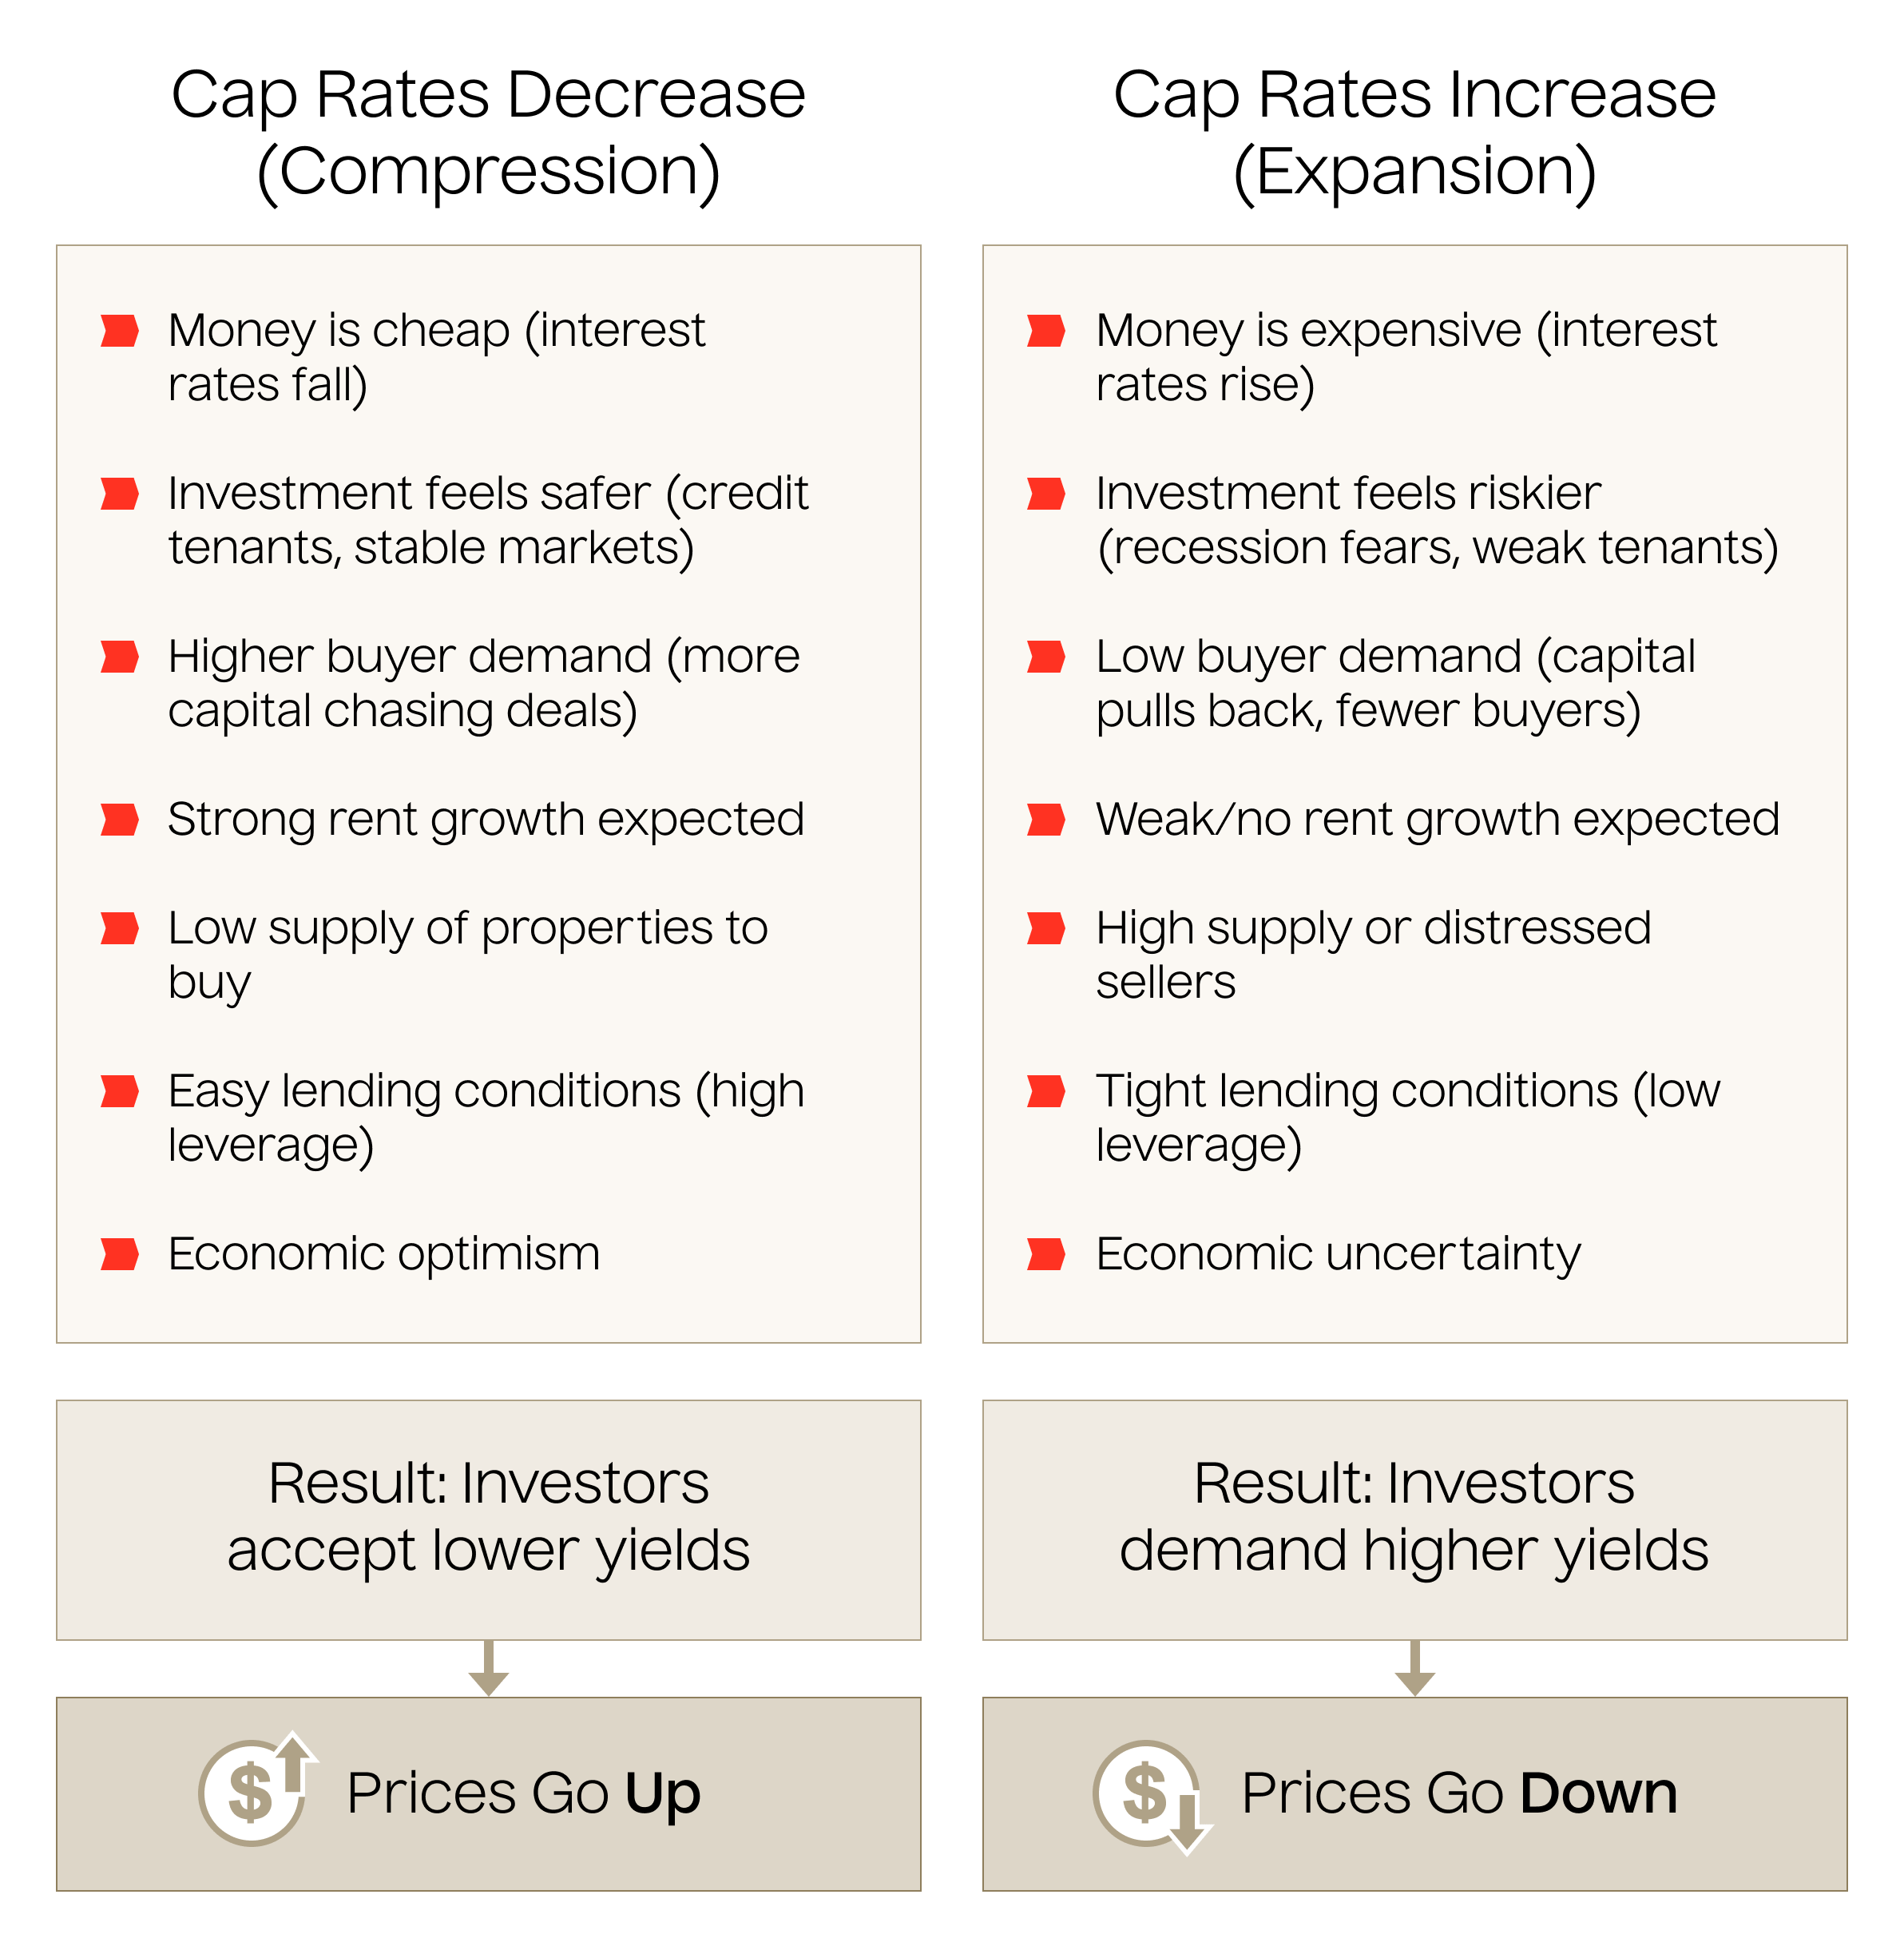
Cap rates fall across a spectrum. Lower cap rates typically correspond to prime locations, strong tenants, long leases, and greater confidence in income growth. Alternatively, a low cap rate could also be due to lower than market occupancy levels, it’s distressed, or there is substantial upside in rents. Higher cap rates often indicate more uncertainty, whether from weaker locations, shorter lease terms, more volatile cash flow, or lower market liquidity.
They also differ across property types. For example, multifamily is often viewed as more resilient because people need housing through cycles and vacancy is spread across many tenants. The broad tenant base, recurring turnover, and deep buyer pool often translate into lower perceived risk and therefore lower cap rates than most real estate asset classes.
Industrial pricing can hinge heavily on tenant quality, lease duration, and the number of tenants. Assets with long-term, creditworthy tenants or diversified multi-tenant rent rolls generally command tighter cap rates. Conversely, buildings leased to a single tenant, shorter remaining lease terms, or tenants with weaker credit profiles typically trade at higher cap rates to compensate for the added income risk. As an example, a single tenant industrial building leased to Amazon on a 10-year NNN lease will trade at a substantially lower cap rate compared to a similar building leased to non-investment grade tenant, all else being equal.
Cap rates also vary significantly by market. A multi-tenant industrial facility located in a high-growth market like Dallas, Texas, can trade significantly below comparable assets in slower-growth or less liquid market such as St. Louis, MO. The properties could be identical in terms of tenant mix and building specs, but investor expectations around rent growth, liquidity, and long-term resilience are not. Cap rates are ultimately a snapshot of market sentiment at a moment in time, reflecting how investors price income durability and future performance.
Why Cap Rates Are Used
Cap rates provide a common language for evaluating how income translates into value. They allow investors to compare assets of different size, geography, and business plan by expressing income as a yield. They also serve as a reference point for how the market is pricing risk and growth at a given moment.
Investors and appraisers often use market cap rates to derive value from NOI, interpret relative pricing between markets, and understand the level of perceived risk embedded in an asset. Lower cap rates generally signal stronger tenant credit, better locations, and higher expectations for rent growth, while higher cap rates often reflect greater uncertainty.
However, cap rates alone can mask the deeper dynamics that drive returns. Two properties with identical cap rates can still perform very differently depending on tenant profiles, market fundamentals, capital needs, and supply and demand conditions. A higher going in cap rate does not guarantee superior returns, and a lower cap rate does not automatically imply weaker performance. This point is illustrated in the example below.

Deal B may be located in a stronger market with higher rent growth, better credit, and deeper liquidity at exit. It may have longer lease terms, more predictable operating costs, or a more compelling mark to market story. Deal A, despite its higher initial yield, may face slower growth, weaker tenant retention, capital intensive improvements, or a less liquid exit environment.
The initial yield does not determine the ultimate return. Cap rates are helpful, but they do not capture market strength, tenant durability, future NOI growth, or exit pricing. Understanding the drivers behind the cap rate is essential for evaluating real performance.
The Math Behind Cap Rates
Cap rates are highly sensitive to small changes in NOI or value. Because they are expressed as a ratio, even modest adjustments can shift perceived yield significantly. For example, if a property generating $1 million in NOI is valued at $20 million, the cap rate is 5.0%. If the value decreases to $18 million, the cap rate rises to 5.56%. This change may seem minor, but it represents a difference of $2 million in pricing.
This sensitivity underscores the importance of understanding the underlying assumptions. Cap rates are not fixed; they move with market conditions and investor expectations. Rising operating costs, changing rent rolls, or shifts in tenant credit can all influence NOI and therefore alter an asset’s implied yield. Sophisticated investors analyze these marginal effects to understand how small operational or market shifts might impact total return over time.
Yield on Cost and the Spread
Yield on cost is similar to a cap rate, but it uses total project cost instead of market value. It measures what the investor actually earns after completing improvements or lease up. Cap rates help describe how the market is pricing income today. Yield on cost describes what the investor is creating through execution.
If an investor spends $12 million all in and generates $720,000 in stabilized NOI, their yield on cost is 6.0%. If comparable assets trade at a 5.0% market cap rate, the stabilized value would be $14.4 million. The difference represents value created through execution, assuming cap rates remain consistent. A useful way to see this relationship in practice is to look at a value-add example where NOI growth pushes yield on cost above the market cap rate.
Value Add Example: Using NOI Growth to Push Yield on Cost Above Market Cap Rates
Let’s assume we are purchasing a 100 unit, 95.0% occupied multifamily property at a 4.75% going in cap rate where market cap rates are at 5.0%. Current in place rents are $1,200 and our business plan is to increase rents to $1,550 by implementing $8,000 per unit of capex to improve the property. To make this investment pencil, our yield on cost once our business plan is executed should be above the prevailing market cap rate of 5.0%.
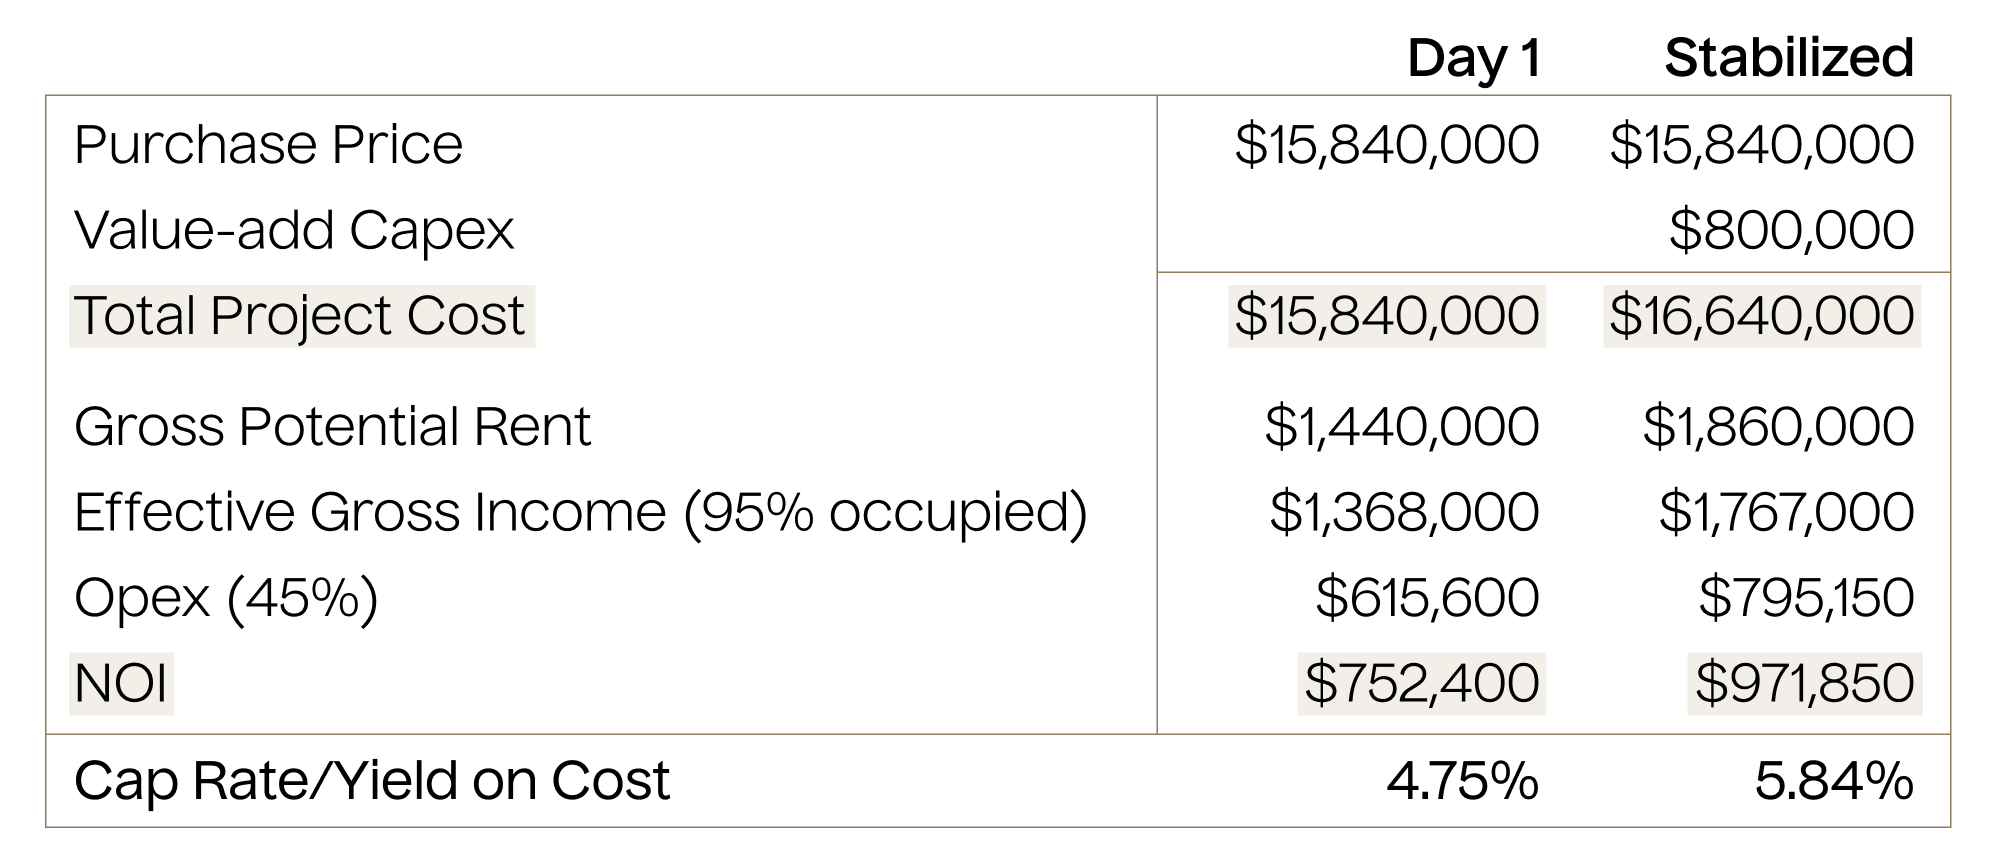
On day one, the investment is purchased at a going in cap rate below the 5.0% market cap rate. Once the business plan is executed and NOI increases, the stabilized yield on cost moves to 5.84%, which is above the market cap rate. That 0.84% spread between what the market is paying for stabilized income and what the investor has created on their total cost is the essence of value add. This translates to a 16.8% gross profit margin (5.84-5.00%/5.00%). If we purchased the property assuming a 50% LTC (purchase + cap ex), this would translate into a 33.6% return on equity (16.8% Gross Profit / 50% LTC).
The Takeaway: Look Beyond the Cap Rate
Cap rates are an important tool, but they are only one piece of the equation. They must be interpreted in the context of interest rates, growth assumptions, tenant credit, and capital structure. Investors who focus solely on the cap rate risk missing the underlying dynamics that truly drive performance.
The best opportunities often balance current yield with quality and growth. A disciplined approach looks past short-term spreads and focuses on total return — income plus appreciation — over the full hold period. This perspective helps protect downside while positioning assets for long-term success.
Cap rates tell you how an asset is valued today. Real value comes from understanding what drives that income tomorrow. For investors, the takeaway is clear: don’t chase the highest cap rate. Focus on the sustainability of cash flow, the quality of tenants, and the fundamentals of the market. Those are the elements that create durable value through all stages of the cycle.