Learn more about everything Lightstone DIRECT has to offer
Generating magic link...
Do Interest Rates Really Drive Cap Rates? What Investors Need to Know

For as long as most of us can remember, the “rule of thumb” in real estate has been simple: when interest rates go up, cap rates go up. The logic seems airtight. Higher risk-free yields should mean higher required returns across all asset classes. But history, and the past few years in particular, tell a more complicated story.
If you’ve invested in private real estate, you’ve probably noticed that cap rates haven’t spiked nearly as much as Treasury yields or the Federal Funds rate. Understanding why can help you avoid oversimplified models and common misconceptions to make more informed decisions about when and where to deploy capital for real estate investments.
Interest Rates and Cap Rates: The Facts
Let’s start with the facts:
- The 10-year Treasury yield climbed from about 1.5% in 2021 to nearly 5% by late 2023 before settling around 4.2% in August 2025.
- The Fed Funds rate rose even more dramatically, from near zero in early 2022 to a target range of 4.25%-4.50% through mid-2025, its highest level in over two decades.1
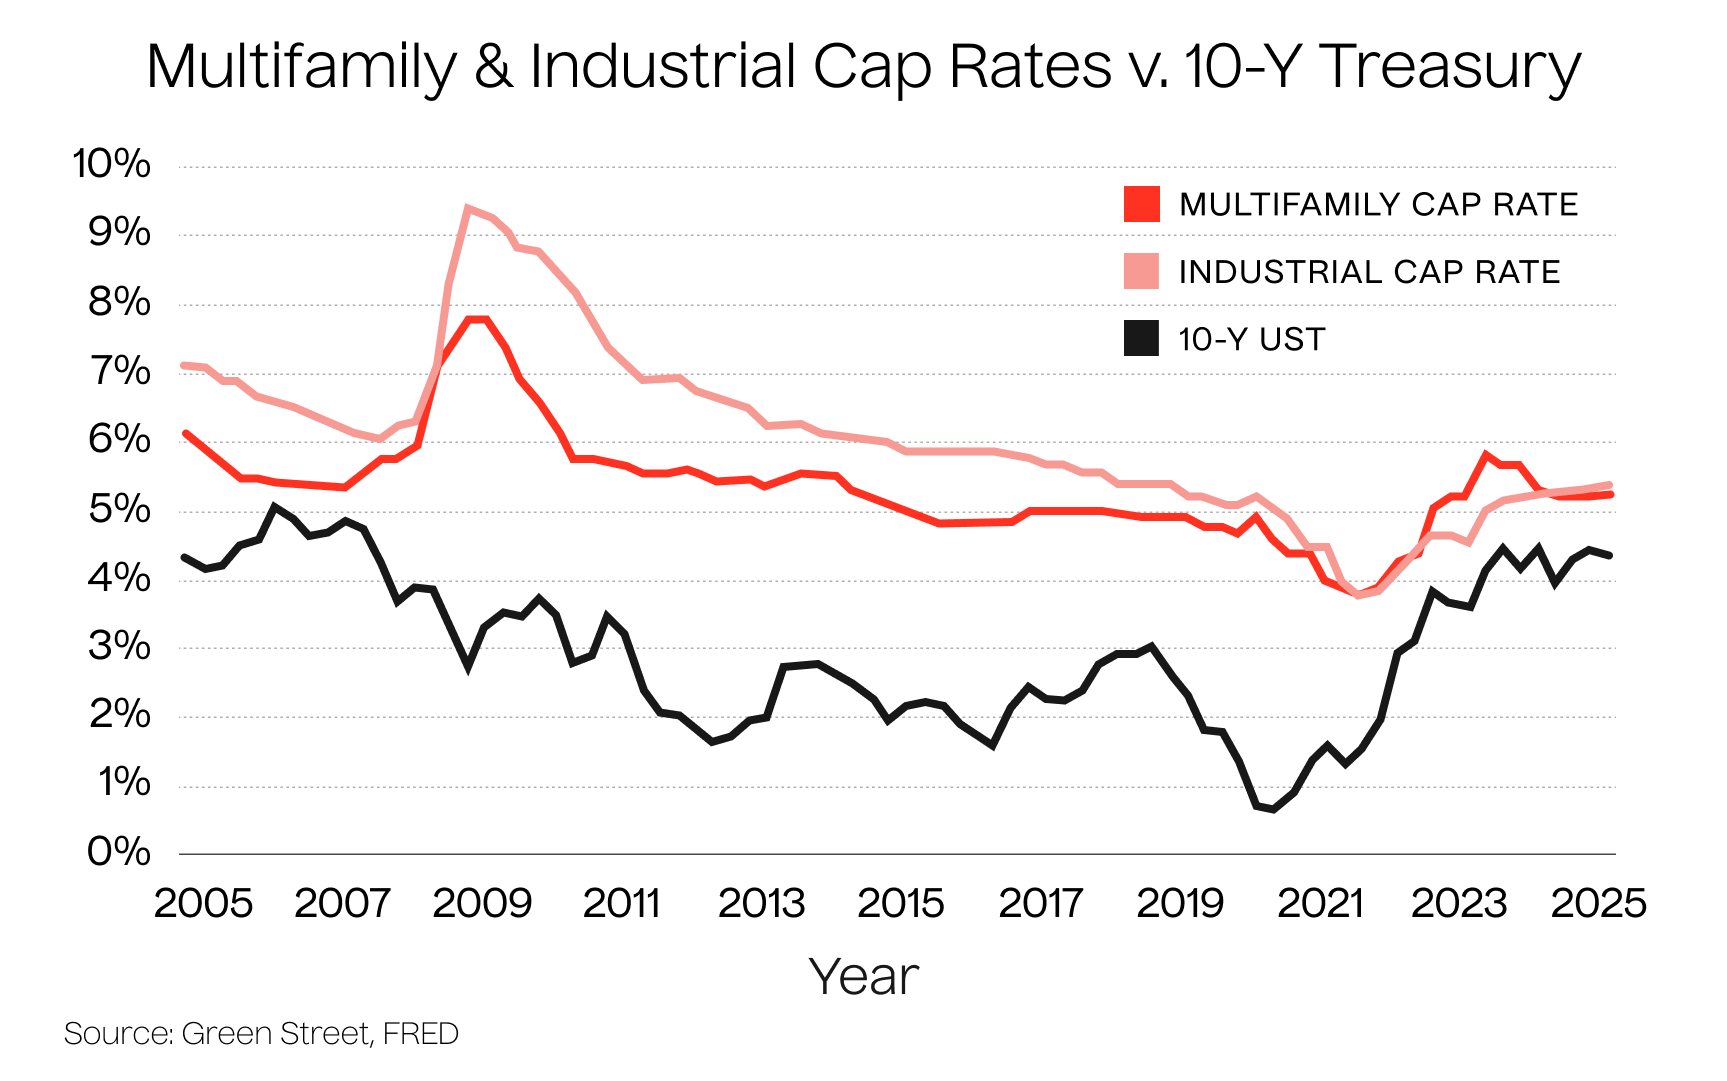
- Over the same period, multifamily and industrial cap rates rose more modestly, by roughly 100 bps.
On the surface, the correlation appears weak. Rates are up by 250 to 400 bps, but cap rates did not move in tandem. If the relationship were truly one-for-one, we would have seen a collapse in property values far worse than what actually occurred of a 20-30% reset in values across most major asset classes.
The figure below, comparing multifamily and industrial cap rates directly against the 10-year Treasury, highlights this divergence. While both cap rates have generally trended in the same direction as the 10-Y UST in the long run, there have been periods where they moved inversely. Taken as a whole, the long-run correlation between the two is still very weak. This is underscored by the most recent cycle where treasury yields increased quickly and substantially, while cap rates moved upward at a much slower pace.
The Case for Correlation
So why does the “cap rates follow rates” story persist? Because there is a correlation — just not a perfect one.
- Public markets react quickly. Real estate investment trusts (REITs) trade in real time and adjust valuations instantly. When the 10-year yield jumped over 200 bps between late 2021 and 2022 implied REIT cap rates rose about 138 bps.2 Private markets followed much slower, but still in the same direction.
- Spread models capture the pull. Analysts often approximate cap rates as the 10-year Treasury yield plus a long-run spread — say, 200–300 bps depending on property type. These models aren’t perfect, but they do capture the influence of interest rates on pricing.
- The last cycle confirms the pattern. Between 2021 and 2024, most property sectors saw cap rate expansion of 75–125 bps, broadly consistent with higher financing costs and reduced investor competition.
Clearly, interest rates matter. They shape available capital, investor sentiment, and the baseline cost of capital.
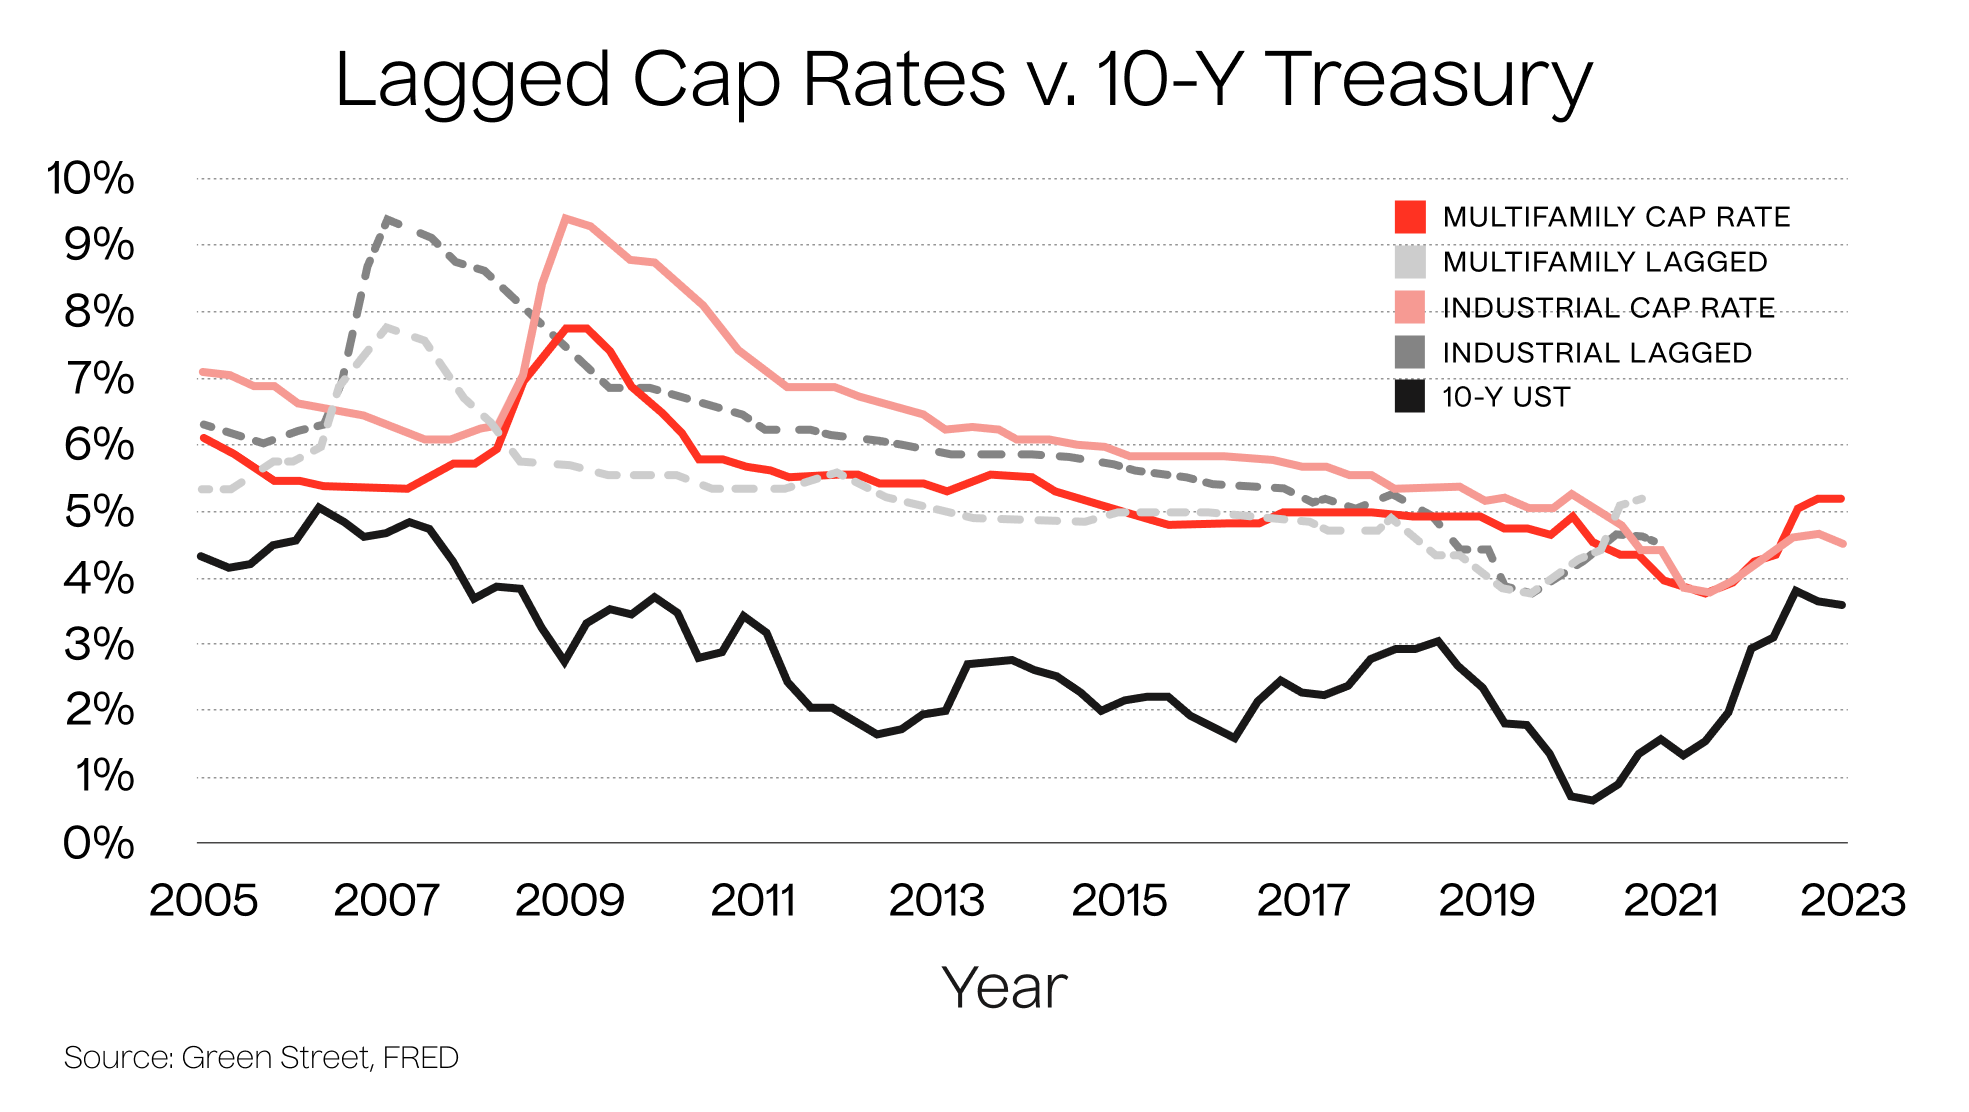
Some argue that cap rates simply trail Treasuries with a delay. The second chart tests that view by overlaying cap rates with a two-year lag. On the surface, the lines appear more closely aligned, with peaks and troughs matching a bit better when shifted forward. Yet even with that adjustment, the overall relationship is not one-to-one, reminding us that cap rates are influenced by many other forces beyond interest rates alone.
Why the Correlation Breaks Down
While interest rates set the backdrop, cap rates follow their own path. There are important reasons for the divergence.
1. Private Markets Adjust Slowly
Unlike stocks or bonds, in private real estate markets, appraisals lag, sellers resist markdowns, and transaction comps are thin. In 2024, multifamily cap rates hovered between 5.6%–5.7% for months even while Treasury yields swung by 100 bps.3 The lag is structural.
2. Capital Flows Matter More Than Rates
Peter Linneman once said that the correlation between interest rates and cap rates is about as strong as the correlation between “pool drownings and Nicholas Cage films.”4 His point: available capital on both debt and equity drives cap rates just as much as interest rates do.
The past two years prove the point.Rising rates didn’t send cap rates soaring; instead, they froze transaction volumes. U.S. apartment sales fell by more than 60% in 2023. In 2024, volumes rebounded 22% to $146 billion, and saw another 12% jump from the previous quarter in Q2 2025.5 Prices didn’t collapse - trading just slowed until capital adjusted.
3. Risk Premiums Flex
Cap rates are not just discount rates, and they also subtract expected income growth. When investors expect rents to grow, they tolerate lower yields. When risk feels elevated, they demand a bigger spread over Treasuries. This is often referred to risk premium. These moving parts explain why cap rate spreads to the 10-year have ranged from near zero to 400+ bps over time.
4. Quality Bias in Deals
During periods of volatility, capital concentrates on higher-quality assets. Core, well-located properties with strong tenancy continue to attract buyers, while weaker or more speculative deals are pulled from the market. As a result, the cap rates that get reported often reflect only the best product available. This doesn’t mean investors are willing to pay the same multiple across the board -it means that lower-quality assets simply aren’t trading, skewing observed averages toward the low end.
The 2025 Snapshot
As we stand today here in November 2025:
- 10-year Treasury yields remains range bound in the 4.0% - 4.5% range
- The Fed has started cutting interest rates with more cuts expected in 2026.
- Cap rates in core property sectors have stabilized, and in some cases declined slightly, as buyers and sellers grow more confident that the rate hiking cycle is behind us.
In short: rates are still high, but cap rates may have already hit their cyclical ceiling.
What This Means for You as an Investor
For a high-net-worth investor, the practical takeaway is that cap rates can’t be forecast by simply adding a fixed spread to the 10-year Treasury. That shortcut ignores the real drivers of pricing.
Here’s what to keep in mind:
- Rates set the baseline, not the ceiling. Interest rates do exert influence. But spreads expand and contract depending on sentiment, risk, and growth expectations.
- Liquidity also drives the cycle. When debt capital and equity are scarce, volumes fall first. Cap rates adjust later and usually less dramatically.
- Quality creates resilience. Institutional-grade assets in strong markets attract capital even when rates rise. That’s why top-tier multifamily in cities like Dallas or Miami still trades near the low-5% range despite higher Treasuries.
- Timing matters less than discipline. If you wait for perfect alignment between rates and cap rates, you may never invest. Instead, focus on assets with durable in-place cash flow, rent growth potential, and strong market fundamentals.
A Counterfactual: What If Cap Rates Had Moved 1:1?
Imagine if cap rates had mirrored the 400-plus basis-point increase in Fed Funds and Treasuries. Multifamily cap rates would sit around 7% to 9% today. Property values would be down by nearly half. The “mass distress” scenarios predicted by some market bears might have come true.
What we’ve seen instead is a more measured adjustment with price declines of roughly 20% to 30% depending on asset quality, with cap rates moving up only about 100 to 200 bps.6 The difference highlights an important reality: real estate does not price in isolation. Cap rates reflect more than just the risk-free rate. They balance interest rate trends with expectations for rent growth, the availability of capital, and the quality and scarcity of assets being marketed.
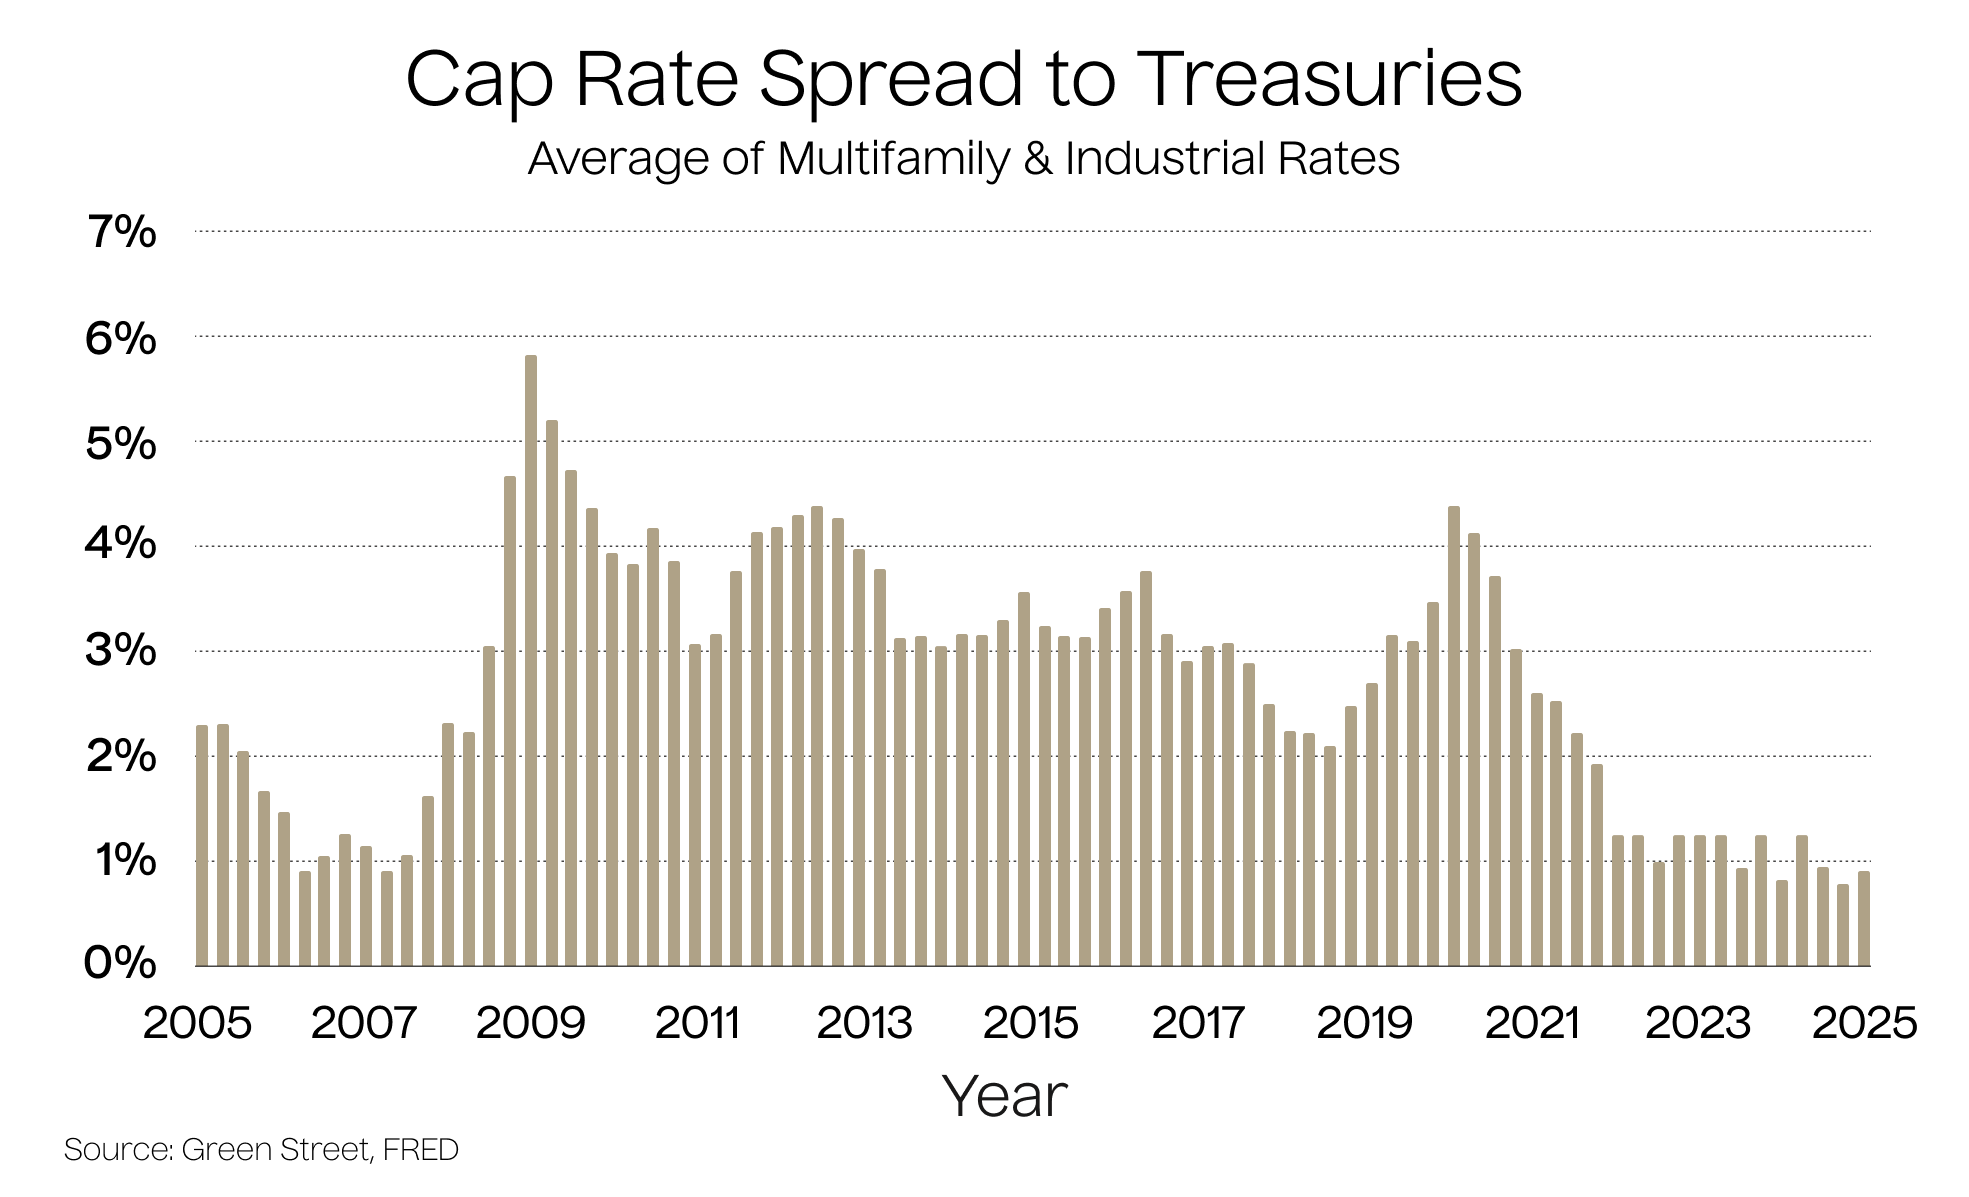
Overtime, this interplay shows up in the spread between cap rates and Treasuries. That margin has widened and compressed through different cycles, and today it remains far tighter than it would have if the relationship were one-for-one.
The Balanced View
So, are interest rates correlated with cap rates? Yes, but imperfectly.
- Yes, directionally. Rising rates in 2021–2024 did push cap rates higher.
- No, not 1:1. Cap rates rose by about 100 to 200 bps while Treasuries rose 250–400 bps.
- Yes, but with lags and caveats. Private markets adjust slowly, and capital flows can matter even more than rates.
For investors, the lesson is clear: don’t oversimplify. Interest rates matter, but they’re just one piece of the puzzle. Cap rates reflect a web of forces — growth, risk, liquidity, and sentiment — that together set pricing in the private real estate market.
Final Thoughts
As you evaluate opportunities in today’s environment, keep both sides of the story in mind. Interest rates will always influence real estate valuations. But in practice, capital flows, risk appetite, and fundamentals carry at least equal weight.
That’s why disciplined investors continue to find attractive deals, even when the 10-year yield is north of 4%. If you can identify assets with resilient cash flows, conservative leverage, and management teams who know how to navigate cycles, you can thrive regardless of the day-to-day moves in Treasury yield.
If you’re curious about how these dynamics play out in any specific Lightstone DIRECT investment, your Capital Formation representative is always available to walk through our cap-rate assumptions and underwriting in detail. With extensive first-party data, deep local market visibility, and true on-the-ground transaction intelligence, Lightstone is uniquely positioned to interpret cap-rate trends with nuance and help you make more informed decisions across cycles.

Sources
1 Green Street Advisors,FRED
2 Pension Real Estate Association(PREA) https://docs.prea.org/pub/4B1D89D8-D638-FD0F-0A7F-2DE1B1DCF272?
3 Freddie Mac https://mf.freddiemac.com/docs/2025_multifamily_outlook.pdf
4 The Linneman Letter https://getrefm.com/app/uploads/2021/11/LL_Fall_2020_FCP_CapRates.pdf
5 RealPage https://www.realpage.com/analytics/apartment-transactions-2024/ & CoStar
6 Source: Freddie Mac https://mf.freddiemac.com/docs/2024_midyear_multifamily_outlook.pdf