How to Evaluate an Outlet Center Part 2: The Metrics to Pay Attention To
Retail Underwriting: What an Investor Should Look For
For investors who may be more familiar with multifamily, evaluating a retail deal can feel like a completely different playing field. The questions are different, the tenant-level economics matter more, and the headline property metrics only tell part of the story. Understanding what really drives the income requires knowing where to look beneath the surface – and that’s what this article will cover.
In Part 1, we focused on the real estate itself: the market, customer draw, tenant roster, physical layout and operator. Part 2 shifts to the tenant-level economics an investor should be asking about: Are stores productive? Can they afford their rent? How do the leases share upside with ownership? And where could income change as leases roll?
No single ratio answers those questions. Sales per square foot shows how productive a store is, occupancy cost ratio shows how much of those sales is absorbed by real estate costs, and sales trends show whether performance is improving or weakening. Percentage rent and lease language determine how store performance reaches ownership, while co-tenancy and lease expirations identify places where income can change. Read together, these metrics give an investor a clearer view of the durability and upside of the property's cash flow.
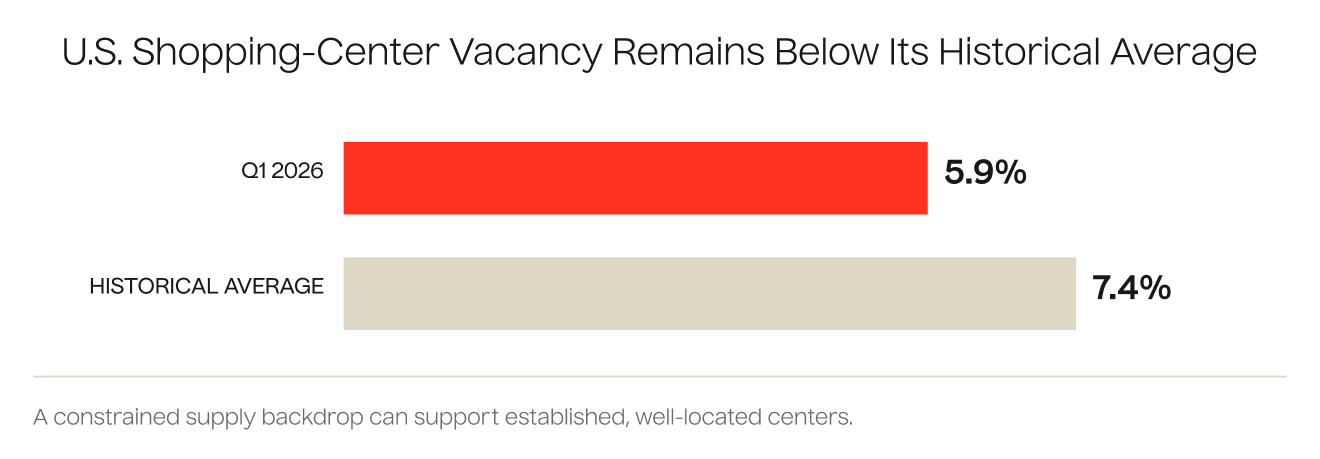
Before going store by store, it helps to understand the market backdrop. U.S. retail space remains tight: CBRE reported a 4.9% availability rate in Q1 2026, while JLL reported that retail construction starts fell 44% year over year in Q4 2025 to 7.1 million square feet. Limited new supply can support established, well-located centers by reducing competing space. But market strength does not tell you whether an individual tenant can support its rent. For an LP, the supply backdrop sets the context; tenant-level economics determine the durability of each income stream.
Start With Sales: Is the Store Productive?
Sales per square foot is simply annual store sales divided by the square footage the store occupies. The calculation is straightforward, but the interpretation is often not. In outlet retail, the metric matters because national brands are constantly comparing locations across their own portfolios and deciding where to send inventory, capital and management attention. In formula terms:
Sales per Square Foot = Annual Store Sales ÷ Occupied Square Feet
A productive store may have a stronger case when its lease comes up for renewal, while a weaker store may have fewer good options. It may ask for rent relief, shrink its footprint or leave altogether. For an owner, sales productivity is therefore less about ranking stores and more about understanding which tenants are likely to keep choosing the property.
The important caveat is that there is no universal sales-per-square-foot benchmark. Jewelry, footwear and large-format apparel operate with different margins, store sizes and economics. The better comparison is usually against similar retailers and, when available, the tenant's own history.
For underwriting, the most useful insight is often the directionality. A store generating $450 per square foot but declining each year may pose more leasing risk than one generating $350 and steadily improving. Sales productivity becomes most valuable when viewed alongside occupancy cost, lease expiration and recent sales trends. Together, those metrics help distinguish a tenant that is merely operating from one that has a strong economic reason to remain at the property.
Can the Tenant Afford the Location?
Sales tell you how much business a store is doing. Occupancy cost ratio, or OCR, tells you how much of that business is being absorbed by the real estate. Depending on the lease and the source data, occupancy costs may mean base rent alone or a broader package that includes common-area maintenance, taxes, insurance and percentage rent. Before comparing two OCR figures, make sure they are measuring the same thing. In formula terms:
Occupancy Cost Ratio = Occupancy Costs ÷ Gross Store Sales
Why does that matter? Because strong sales do not automatically mean a healthy lease. A busy store can still be over-rented, while a lower-volume store can remain perfectly viable if its occupancy burden is modest. The more room a tenant has between sales and occupancy costs, the more capacity it generally has to absorb volatility and, potentially, future rent growth.
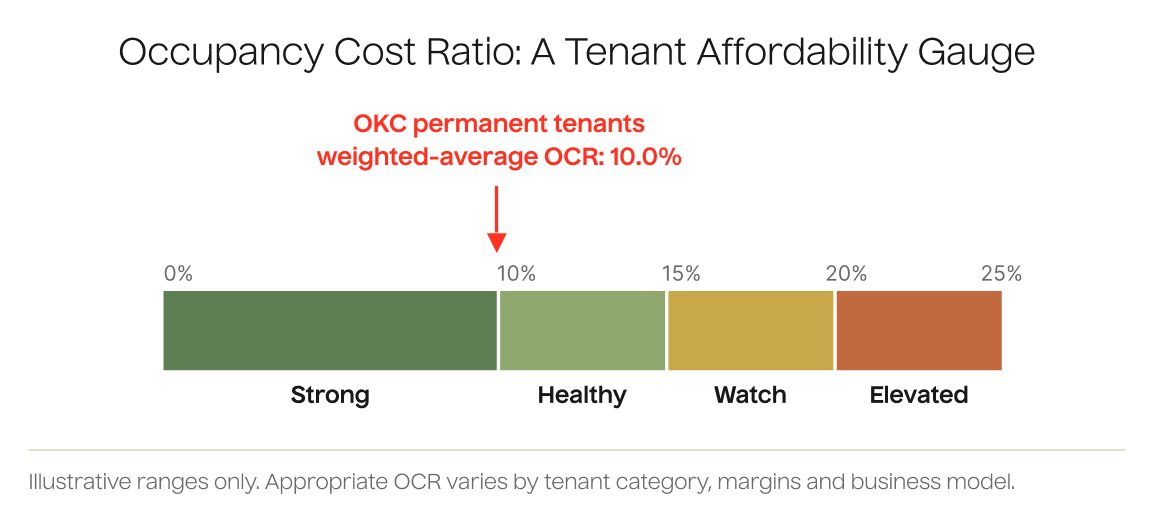
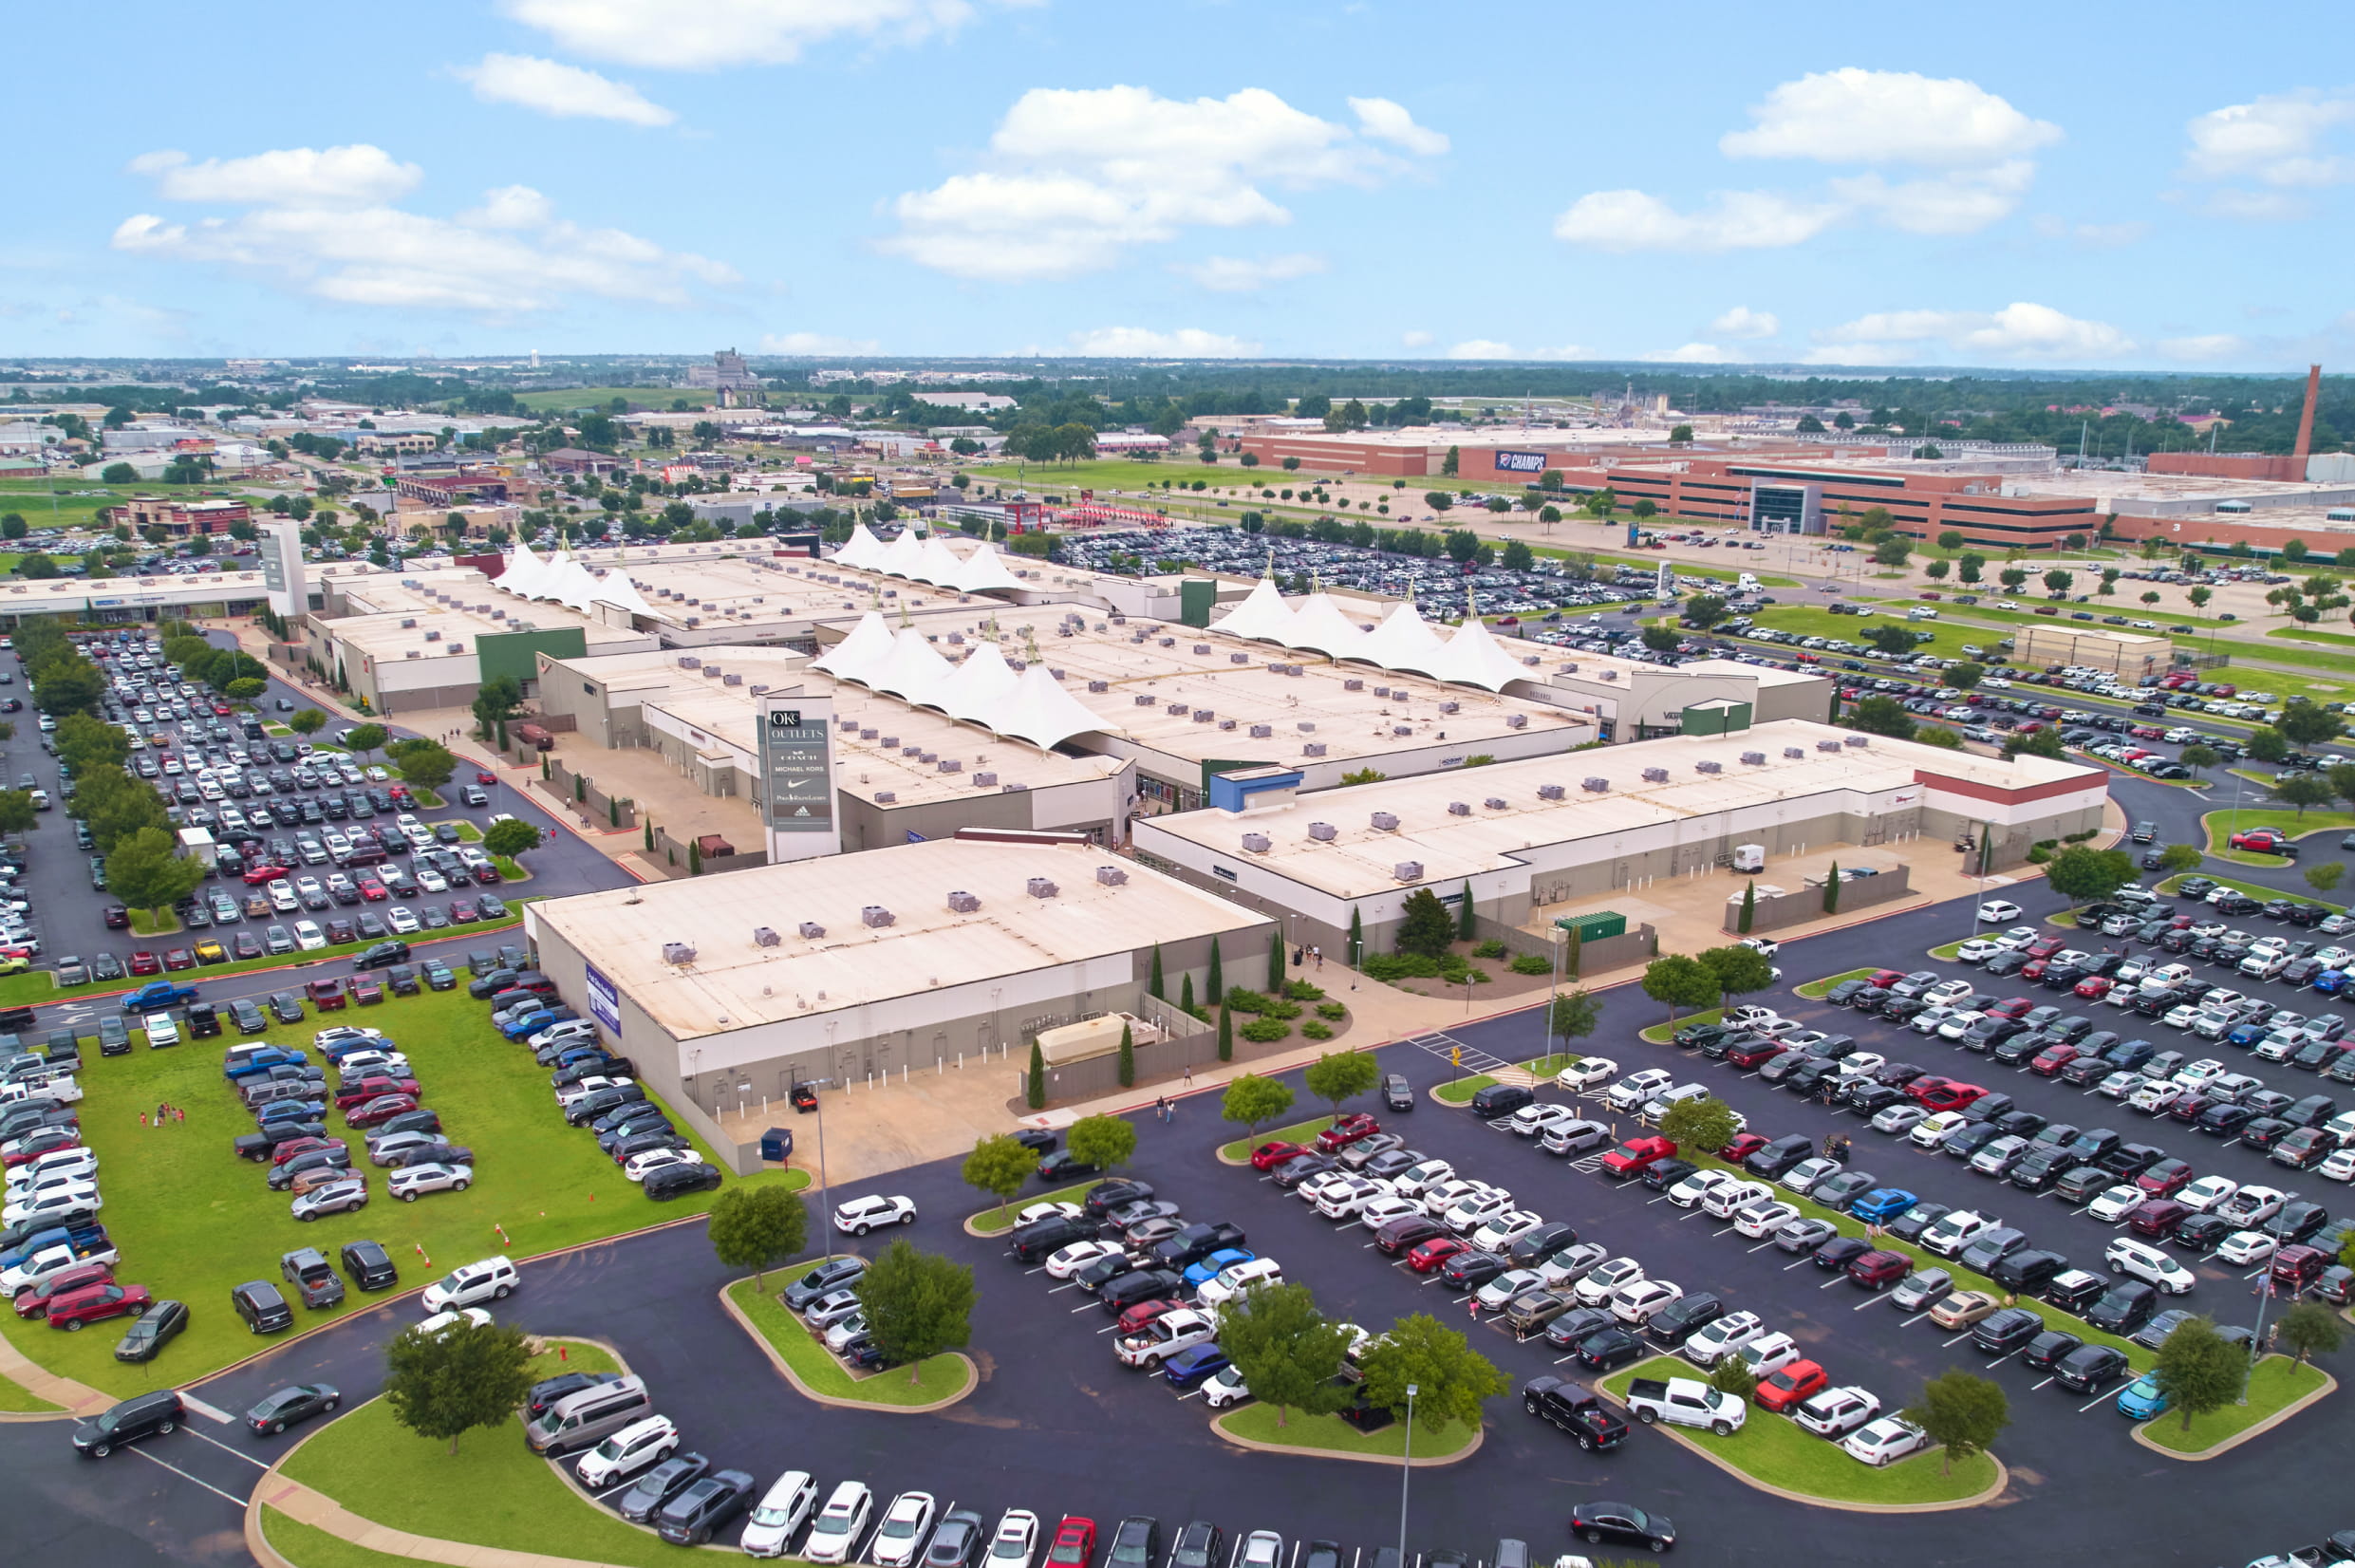
The chart below provides a useful way to think about OCR as an affordability gauge rather than a hard cutoff. At OKC Outlets (a current Lightstone DIRECT offering as of August, 2026) permanent tenants have a weighted-average OCR of roughly 10%, placing the property around the strong-to-healthy range. That is a positive signal, but the real underwriting value comes from comparing each tenant’s occupancy burden with its category, sales performance, and lease economics.
Read Sales and OCR Together
This is where the two metrics become more useful than either one on its own. Sales show productivity; OCR shows how much of that productivity is already spoken for by occupancy costs. The framework below is intentionally simple. Its purpose is not to label tenants as good or bad, but to show how the same sales number can mean something very different depending on the rent burden attached to it.
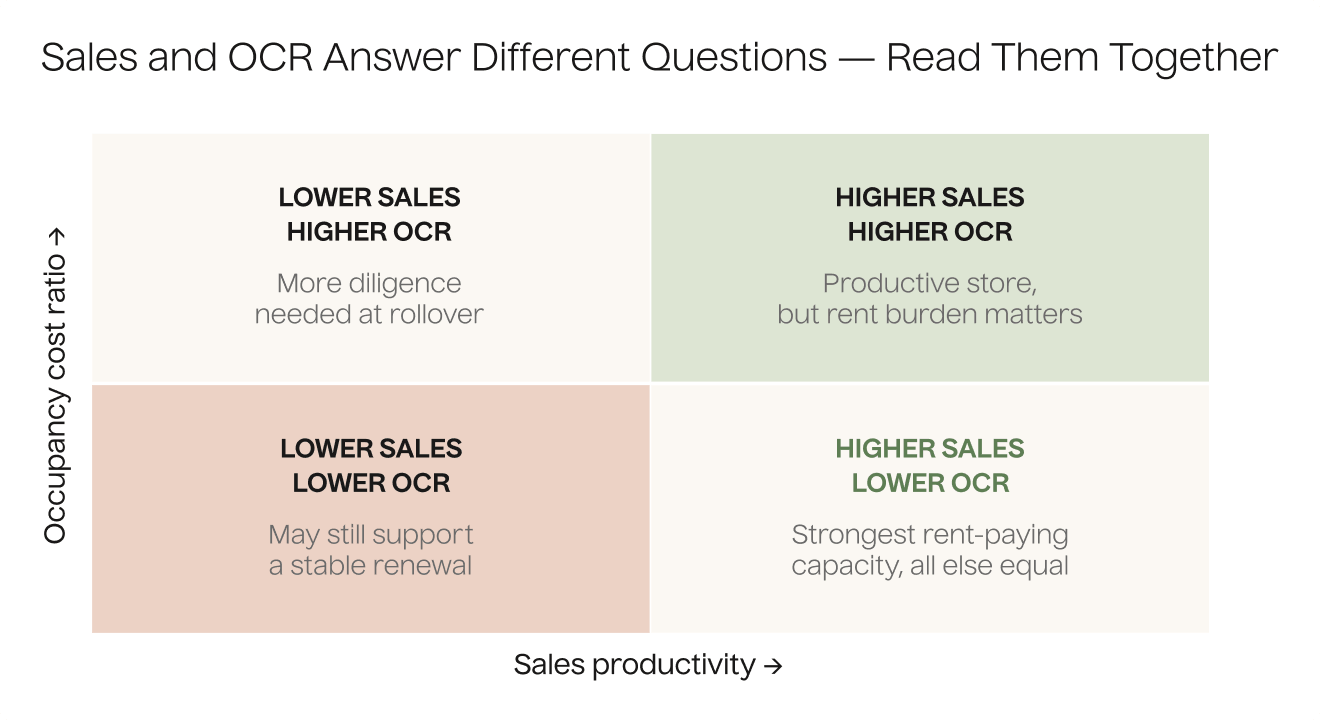
A high-sales, low-OCR store generally has the most room to pay rent, all else equal. High sales with a higher OCR can still describe a strong location, but future rent growth deserves more scrutiny. Lower sales with a low OCR may remain stable because the store is not carrying much real estate burden. The combination that deserves the closest look is lower productivity paired with a heavier occupancy cost, especially as a lease expiration approaches.
A Snapshot Is Not Enough: Watch the Sales Trend
Sales per square foot tells you where a store is today, and the trend tells you where it may be going. A high-volume location that has declined for several years can be more concerning than a moderate-volume store that is steadily improving.
Useful context includes same-store growth, multi-year volatility, performance after a renovation and, when the data is available, results relative to other locations in the brand's portfolio. Reporting quality matters too - how much of the rent roll is covered by reliable sales reporting? How often is it delivered? What audit rights does the landlord have? A metric is only as useful as the information behind it.
Percentage Rent: Does Ownership Participate in the Upside?
Many outlet leases include percentage rent on top of fixed base rent. The basic idea is simple: once a tenant's sales rise above an agreed breakpoint, a portion of the excess sales is paid to the landlord. The breakpoint may be written directly into the lease or derived from the base rent and percentage-rent rate.
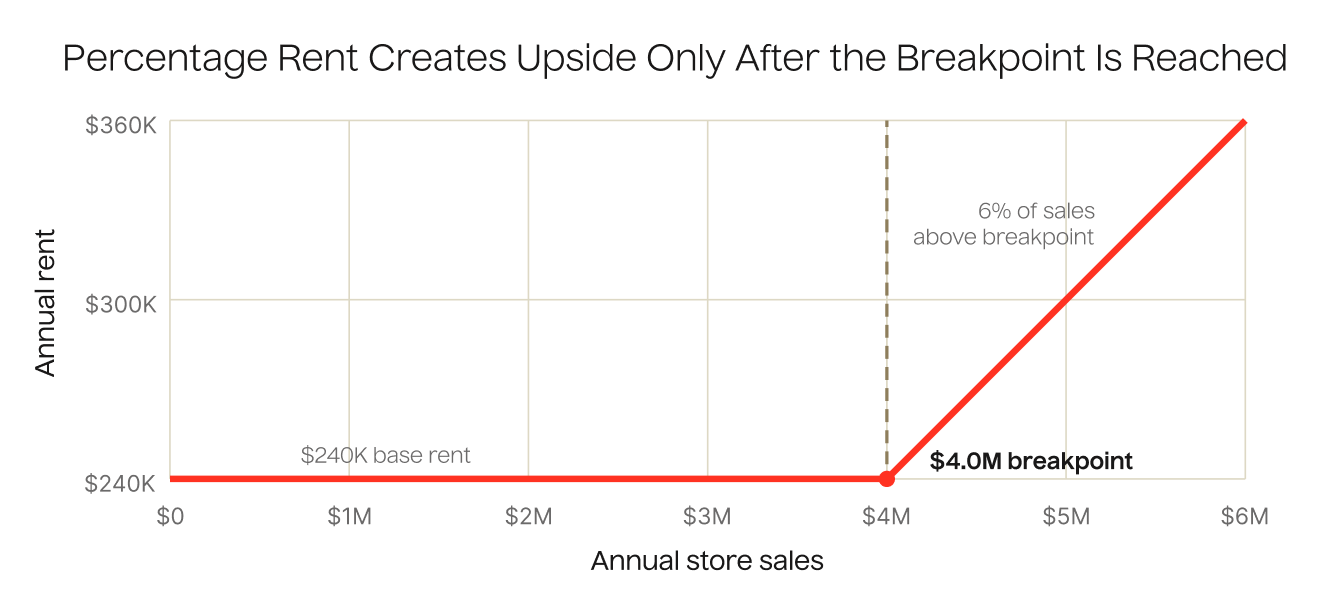
The chart makes the key point visible. Until the breakpoint is reached, a percentage-rent clause may contribute nothing. Once sales move above it, ownership begins to participate in the upside. So the important question is not just whether percentage rent exists, but whether the breakpoint has historically been achievable.
The definition of gross sales matters just as much. Returns, online transactions, exclusions and audit rights can all change what counts toward the breakpoint and, ultimately, how much variable rent is collected. Two leases can both say 'percentage rent' and still produce very different economics.
Lease Structure: How Store Performance Becomes NOI
A tenant can be productive and still have a lease that limits the value flowing to ownership. Base rent is generally the most durable layer because it is contractually owed regardless of store sales, subject to the tenant's broader lease rights. Expense recoveries can protect NOI by passing through common-area maintenance, taxes and insurance, while percentage rent can add upside. Sales-reporting language gives the owner the information needed to monitor the tenant and enforce those economics.

However, the rent roll is only the first page of the story. Renewal options can preserve occupancy while limiting the landlord's ability to reset rent, tenant-improvement obligations and leasing commissions affect the cost of a renewal or replacement, and kick-out rights can let a tenant leave if performance falls below a negotiated threshold. The lease abstract and the underlying documents are where the real economics live.
Co-Tenancy: When One Vacancy Can Reach Beyond One Store
Co-tenancy provisions connect one tenant's obligations to the presence or operation of other tenants, or to a minimum occupancy level at the center. Opening co-tenancy can determine whether a retailer is required to open in the first place. Operating co-tenancy can apply later if a named anchor closes, a group of designated tenants leaves or occupancy falls below an agreed threshold.
The effects of a co-tenancy trigger can extend well beyond the vacant space itself. Depending on the lease, other tenants may gain the right to pay reduced rent, delay opening or terminate after a cure period. Investors should understand which tenants have these protections, what events trigger them, how much time the landlord has to cure the issue and how much rent could be affected. Co-tenancy provisions are common in retail, but the key underwriting question is the scope of the potential exposure.
Rollover Creates the Opportunity, Leasing Execution Captures It
Weighted average lease term, or WALT, compresses the remaining duration of the rent roll into one number, usually weighted by rent or square footage. A longer WALT can provide near-term visibility, while a shorter WALT creates more rollover, but that is not automatically negative. It can also give ownership the opportunity to reset rents, improve lease language or replace weaker tenants.
The expiration schedule is usually more revealing than WALT by itself. A cluster of near-term expirations among productive, low-OCR tenants may create mark-to-market potential. Put the same expiration schedule against weaker stores and the picture changes: ownership may be facing concessions, tenant improvements, downtime, or lost occupancy.
What happens at rollover ultimately depends on leasing execution. A strong leasing team has to know which tenants to retain, where rents can be pushed and when replacing a weaker tenant may create more value than renewing it. Historical renewal activity can help indicate whether tenants have been willing to recommit to the property, although the economics behind those renewals still matter.
As Akiva Elazary, Lightstone’s Vice President of Investments and longtime lead on the firm’s retail strategy, explained during Lightstone DIRECT’s OKC Outlets webinar, outlet tenants can be especially “sticky.” Once stores are open and performing well, tenants with reasonable sales and occupancy costs tend to renew at high rates. That dynamic is visible at OKC Outlets, where approximately 85% of square footage that came up for renewal over the past five years was renewed, and those renewals were completed at a positive rent spread to expiring rents.
Putting It All Together
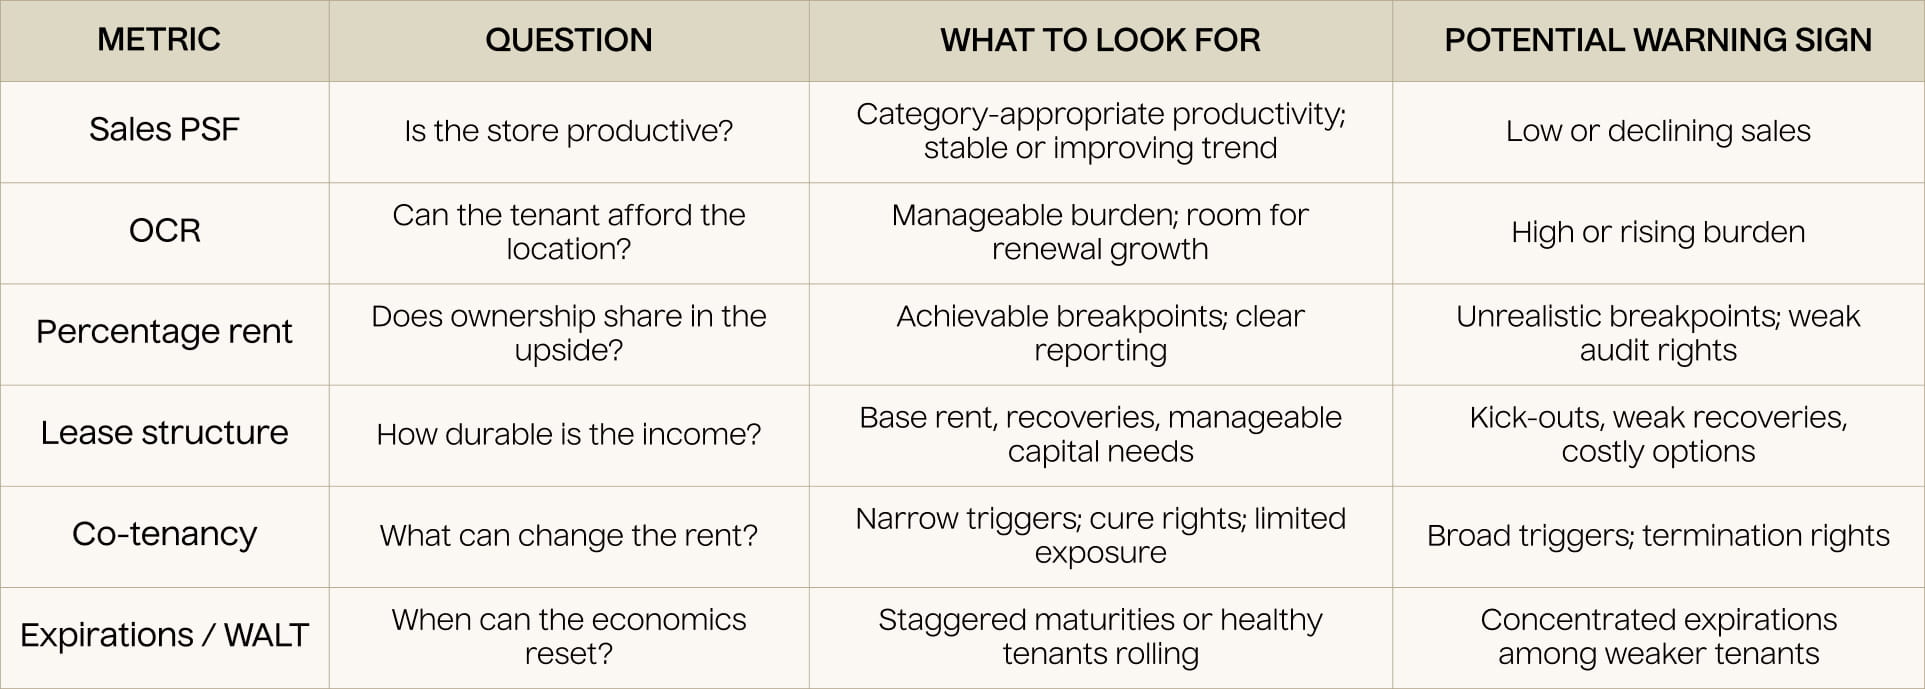
No single metric decides whether an outlet center is attractive. A productive tenant with a low OCR may look like a strong renewal candidate, but the value still depends on its lease terms and where current rent sits relative to the market. Near-term expirations may create upside, but only if the operator can retain the right brands and manage the capital cost. Strong historical occupancy helps, but co-tenancy can make the downside larger than one vacancy would suggest.
The best underwriting connects the tenant-level details back to the property-level business plan. Which tenants are healthy enough to renew? Which rents have room to grow without overburdening the store? How much percentage rent is actually recurring? What will it cost to execute the leasing plan? How much NOI could move in a downside case? Those are the questions that turn operating data into an investment thesis.
Sources
- Oklahoma City Outlets, Retail Equity Investment Offering, Lightstone DIRECT, July 23, 2026.
- Cushman & Wakefield, U.S. Retail MarketBeat, Q1 2026: 5.9% shopping-center vacancy versus a 7.4% historical average.
- CBRE, U.S. Retail Figures, Q1 2026: 4.9% retail availability; average asking rents up 2.4% year over year.
- JLL, U.S. Retail Market Dynamics, Q4 2025: 7.1 million square feet of retail construction starts, down 44% year over year.
- Lightstone DIRECT, OKC Outlets Webinar, August 2026 (Akiva Elazary, Vice President of Investments).
This article is for general informational and educational purposes only. Neither this article nor the information contained in it constitutes an offer to sell or a solicitation of an offer to buy any security, including any interest in OKC Outlets or any other Lightstone offering. Any such offer is made only by means of a confidential private placement memorandum to persons who qualify as accredited investors and who have been verified as such in accordance with Rule 506(c) of Regulation D. Forward-looking statements and hypothetical examples reflect current expectations and assumptions only; actual results may differ materially. Third-party information is believed to be reliable but has not been independently verified. Past performance is not indicative of future results.

Annina Vaisanen
Annina Vaisanen is part of the Investor Relations team at Lightstone DIRECT, where she focuses on coordinating and enhancing the investor experience across the platform. In addition to overseeing investor relationships, she also plays a key role in streamlining systems and processes that support efficient operations across the group.


How to Evaluate an Outlet Center Part 1: Understanding the Real Estate


.jpg)
[Webinar] Retail's Quiet Comeback
[Video] Introducing OKC Outlets
[Webinar] New Opportunity: OKC Outlets
%20(1).jpg)
Retail Real Estate Investing: Why Outlet Centers Deserve Another Look