An Investor's Guide to Real Estate Return Metrics

When private real estate sponsors market an opportunity, the headline returns can look deceptively simple: a mid-teens IRR, a 1.7x equity multiple, a 7% cash-on-cash yield. But each metric answers a different question, providing a different viewpoint on the potential return of the investment. Experienced LPs can quickly parse out which return metrics are most relevant for their own evaluation, versus metrics that primarily serve as underwriting tools used by the sponsor.
This distinction is critical as you review investment materials. Some metrics are best read from the investor’s seat: How much cash might I get back, and when? What is the total net profit potential of this deal? Others are more useful from the operator’s seat: Is the deal basis attractive, can the business plan create value, and does the projected exit make sense? In Lightstone DIRECT materials, we strive to make this distinction clear.
LP-facing metrics tend to focus on distributions, total value creation, and timing of proceeds. Sponsor-facing metrics tend to focus on income generation at the asset level, basis, risk, and whether the spread between going-in economics and stabilized economics justifies the work. Both may be relevant to you as an LP investor as you evaluate the deal, but the former are the most relevant in terms of understanding the potential net returns to you.
Let’s dive into some definitions of major real estate return metrics. At the end of this article, we will take a closer look at some of these metrics in the real-world scenario of a Lightstone DIRECT multifamily investment opportunity.
IRR: The Timing-Sensitive Total Return Metric
Internal rate of return, or IRR, is the discount rate that sets the net present value of an investment’s cash flows to zero. In plain English, it is the annualized return implied by the timing and size of all cash inflows and outflows. Because it incorporates timing, IRR is more sensitive than most return metrics to whether proceeds arrive early or late.
For an LP investor, IRR is one of the most relevant top-line metrics because it captures the whole life of the investment: initial capital, interim distributions, and exit proceeds. It is especially useful when comparing two deals with different hold periods. A 1.6x multiple in three years is not the same as a 1.6x multiple in seven years, and IRR helps show that difference. Lightstone’s offering materials cite projected net IRR as a primary return metric for individual LPs to consider.
For the sponsor, IRR is still important, but often as an output rather than the first underwriting building block. Sponsors are not buying a given IRR off the shelf; they create it through mark-to-market strategies, financial engineering, operational improvements, and other strategies. A sponsor may consider “unlevered” IRR as a phase of underwriting to understand the projected performance of an asset absent of financing considerations.
The caution with IRR is that it can flatter deals that return capital quickly, even if the total profit is modest. For LPs, IRR should almost never be read alone.
Equity Multiple and MOIC: The Simplest Answer to “How Many Dollars Back?”
Equity multiple and MOIC are more or less interchangeable. MOIC, or multiple on invested capital, measures total value received divided by total equity invested. Equity multiple is often used interchangeably in real estate to mean much the same thing: total cash inflows over total equity outflows.
For LP investors, this is arguably the cleanest total-return metric of all. It answers the simplest question: if I invest one dollar, how many dollars do I get back over the life of the deal? If the answer is 1.7x, that means each dollar invested is projected to return $1.70 in total proceeds, inclusive of returned capital. Many investors look to equity multiple and MOIC as the cleanest “total return” metric for a real estate investment. Contrary to an IRR, however, an equity multiple or MOIC says nothing about the time it took to earn the profit. Individual LPs, who may have greater liquidity needs, should consider this dynamic when looking at an equity multiple or MOIC.
Cap Rate: The Market Pricing Shorthand
The capitalization rate is one of real estate’s most widely used valuation tools. Freddie Mac’s appraisal guidance describes direct capitalization as converting income into value using the basic relationship of income, rate, and value; in practical terms, cap rate is the ratio of a property’s NOI to its fair-market value.
For LP investors, cap rate matters, but usually indirectly. It helps answer whether the sponsor is buying well and whether the projected exit is believable. If a deal is being acquired at a cap rate that looks too tight relative to comparable assets or local fundamentals, that may suggest limited downside protection. If exit assumptions require cap-rate compression to achieve target returns, that should prompt more scrutiny.
For sponsors, cap rate is foundational. It sits at the heart of acquisition pricing, comparative market analysis, and exit underwriting. IRR and equity multiple can be extremely sensitive to exit cap rates. Hence, any sponsor conducting level-headed underwriting will model several exit cap scenarios to assess the range of possible outcomes.
.jpg)
Recent Green Street data is a reminder that cap rates are not static. As of December 17, 2025, Green Street reported that apartment cap rates in the top 50 U.S. markets were broadly flat year over year in aggregate, while industrial cap rates were up 20 basis points since the beginning of 2025 on average. That sort of market movement directly affects sponsor underwriting and should influence how LPs judge the realism of exit assumptions.
Cap rate, then, is not the return metric most LPs should anchor on. It is the market-value translator behind the scenes, and a key input for a GP’s return modeling. The question for any LP investor is whether that modeling is reasonable.
Cash-on-Cash Return: The Income Lens
Cash-on-cash return measures annual pre-tax cash flow relative to the equity invested. This metric is especially common in commercial real estate because it focuses on cash yield on actual cash invested. One important note: that cash-on-cash excludes proceeds from sale, refinance, or appreciation and should not be confused with overall investment performance.
For LP investors, this metric is immediately relevant. Many accredited investors are not looking only for total return; they also care about current income. Cash-on-cash helps answer: what annual cash yield might I receive during the hold? Near-term cashflow is a priority for Lightstone – as an operating philosophy, Lightstone seeks to acquire assets that have strong in-place cashflow, taking the conservative approach of seeking a high proportion of total returns from cashflow, rather than on anticipated exit proceeds. The former allows us to control our own destiny: improving cashflow through value-add improvements and operational rigor. The latter is more speculative. This emphasis shows up in Lightstone DIRECT investment opportunities as well, where near-term cashflow is prioritized, and monthly distributions are the target.
That said, a deal with strong current distributions can still produce a mediocre total return if it lacks growth or exit upside. Conversely, a heavier value-add deal may show modest early cash-on-cash but generate stronger IRR and multiple later.
Stabilized Return on Cost: The Sponsor’s Value-Creation Checkpoint
Stabilized return on cost, sometimes called stabilized yield on cost, compares a future stabilized NOI to total project cost. It is essentially a measure of what the asset is expected to earn once the business plan has been executed, relative to all-in basis. For example, in Lightstone investment materials you may see “Stable Year 4 Yield on Cost” — the projected Year 4 NOI divided by total property-level investment cost.
This is one of the clearest examples of a sponsor-centric underwriting metric. LPs should understand it, but they should not mistake it for an investor return metric. It says little by itself about investor-level fees, cash-flow timing, leverage effects, or exit proceeds. What it does say is whether the sponsor expects to create enough operating income relative to basis to justify the business plan.
That makes it enormously important inside the underwriting model. If a sponsor can buy at one yield, improve the asset, and stabilize at a materially higher yield on cost than prevailing market cap rates, value has been created. In development or heavy value-add deals, that spread is often central to the investment thesis.
For LPs, the right way to read stabilized return on cost is as proof of business-plan logic. It helps answer: is there a genuine asset-level arbitrage here, or are projected investor returns mostly a function of leverage and optimistic exits? A strong stabilized return on cost can be evidence that value is being manufactured through operations, leasing, and cost control rather than merely hoped for.
Which Metrics Matter Most to Whom?
For an LP evaluating whether to invest, a commonly evaluated triad is net IRR, equity multiple/MOIC, and cash-on-cash return. Together, they answer three distinct questions: how do returns manifest over time, how much total money comes back, and how much income may arrive during the hold.
The best investors read both sets together. They do not stop at a target IRR, and they do not get lost in property-level jargon either. They ask whether the sponsor’s underwriting mechanics credibly support the LP-facing return targets.
That is ultimately the point of these metrics. Not to decorate a pitch deck, but to illustrate how value is created and how return is ultimately delivered to LP investors.
Also worth noting: while projected returns are necessary for evaluating potential investments, one number may matter more than all of these return figures combined: the amount of their own money the GP is putting into the deal. The more GP co-investment, the more the GP is incentivized to pursue the best risk-adjusted returns, in alignment with LP investors. This is why Lightstone invests a minimum of 20% of the equity in each transaction. These are investments the firm would make anyway.
Applying These Metrics: Hidden Lakes Apartments, Grand Rapids
Lightstone DIRECT’s multifamily investment opportunity – Hidden Lakes Apartments – is a useful example because the projected return profile is more income-oriented and basis-driven.
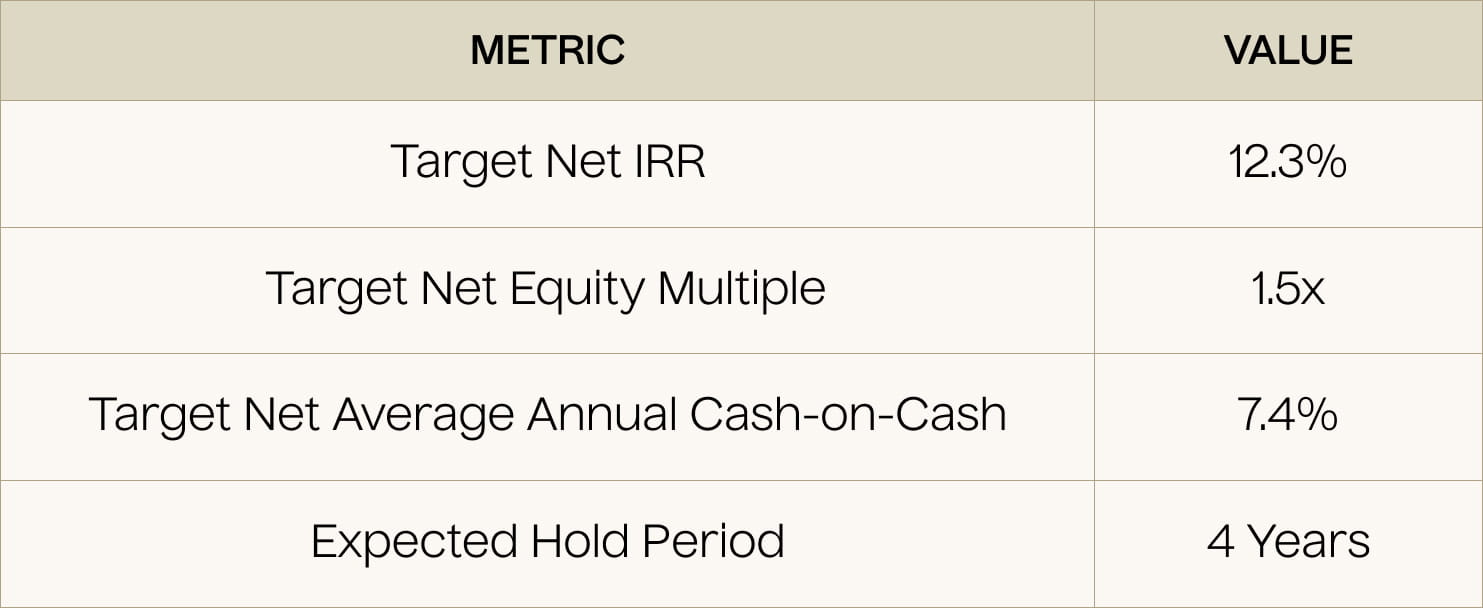
Here are the key projected figures:
- 4-year hold
- 6.3% pro forma going-in yield
- 6.7% pro forma stable Year 4 yield on cost
- 5.75% exit cap rate
- 12.3% projected net IRR
- 1.5x projected net equity multiple
- 7.4% projected net average annual cash-on-cash return.
Lightstone’s business plan entails improving occupancy from roughly 90% to the mid-90% range, capturing moderate rent growth, partially renovating 19% of units at $6,500 per unit for a projected $90 premium, implementing bulk internet for a projected $105,000 of incremental NOI in Year 3, and lifting ancillary income through utility billing, pet rent, renters’ insurance, and trash fees.
That makes Hidden Lakes a strong illustration of the difference between LP-facing return metrics and sponsor underwriting metrics.
For the LP investor, these numbers suggest meaningful current income, moderate overall upside, and a return profile that is less dependent on aggressive assumptions than a more speculative repositioning.
From the GP perspective, Hidden Lakes is being acquired at a 6.3% going-in yield and underwritten to a 6.7% stable Year 4 yield on cost. That is not a dramatic yield expansion story. Rather, it reflects a more conservative business plan in which value is created through incremental NOI growth, operating efficiency, and a favorable acquisition basis.
IRR: The Best Single Measure of the Total Investor Outcome
For Hidden Lakes, the projected net IRR is 12.3% over a 4-year hold. This is the most complete LP-facing metric because it captures both the interim distributions and the final sale proceeds, while also accounting for timing.
In this deal, IRR is not being driven by one dramatic lease-up or by multiple expansion. Instead, it comes from a combination of current income, moderate NOI growth, and a projected sale at a 5.75% exit cap rate. The sensitivity table makes clear how dependent the IRR is on those underlying assumptions. At the base case 5.75% exit cap, the projected net IRR is 12.3%; if the exit cap tightens to 5.25%, projected net IRR rises to 15.2%; If the exit gap widens to 6.75%, the projected net IRR drops to 5.8%.
That is exactly how LPs should use IRR here: not as a standalone promise, but as a summary output of the underwriting.
The Numbers at Work: $200K Hypothetical LP Investment
In a hypothetical $200,000 investment, an LP could earn a net profit of $103,041, with projected net cash flow over the hold totaling enough to support the targeted 1.5x net equity multiple and 12.3% net IRR.
The projected annual cash-on-cash profile is
- 6.9% in Year 1, or $13,800
- 6.6% in Year 2, or $13,200
- 7.9% in Year 3, or $15,800; and
- 8.3% in Year 4, or $16,600 …
… averaging 7.4% over the hold, or a total of $59,400 in net proceeds from cashflow (or 58% of their total net profit on a $200K investment).

Cap Rate: The Valuation Assumption Behind the Return Story
For Hidden Lakes, the exit cap rate is underwritten at 5.75%. While not immediately relevant to an LP’s net returns, it materially shapes the projected exit value and therefore the IRR and equity multiple.
Hidden Lakes is being acquired at $138,021 per unit, while selected comparable sales average $156,114 per unit untrended and $160,544 trended at 3.0% inflation. It also notes that the property’s projected exit value of $170,000 per unit in 2030 is only about 5.6% higher than the trended comparable average. That is meant to support the reasonableness of the exit underwriting.
For LPs, this is where cap rate becomes practically useful: not as a headline return metric, but as a realism check on the projected sale.

Annina Vaisanen
Annina Vaisanen is part of the Investor Relations team at Lightstone DIRECT, where she focuses on coordinating and enhancing the investor experience across the platform. In addition to overseeing investor relationships, she also plays a key role in streamlining systems and processes that support efficient operations across the group.