Exit Cap Rate and Cap Rate Spread: What LPs Should Watch

Type "cap rate calculator" into a search bar and you will find a hundred of them: two input boxes, a button, an answer in large friendly type. Net operating income divided by purchase price. A $3.0 million NOI on a $50 million building is a 6.0% cap rate, and the calculator produces this in less time than it took to read the sentence. It is division. A patient middle-schooler could pass the test. Why, then, do analysts get paid serious money to dissect cap rates?
The answer is that the cap rate you can calculate is the least interesting cap rate in the deal. The going-in cap is an observable fact: this income, this price, today – based on an appraisal, a concrete expression of fair-market value. The two cap rates that decide whether a value-add investment succeeds are not observable at all. One is the exit cap rate, an assumption about what buyers will pay for income four or five years from now. The other is the cap rate spread, the gap between property yields and the risk-free alternative, which is the closest thing the asset class has to a market thermometer. You won’t find these dynamics in a “cap rate calculator.”
Going-In Cap Rate: The Number You Can Calculate
The going-in cap rate is a property's current annual net operating income divided by its purchase price. It is the only cap rate in a deal that can be observed rather than assumed. (For the full formula and how to calculate it, see what is a cap rate.)
Cap rate = NOI ÷ Price
Our illustrative $50 million building with $3.0 million of NOI trades at a 6.0% cap. Run it in reverse and the same formula prices a building: $3.0 million of income capitalized at 6.0% is worth $50 million. The inverse framing is perhaps more useful. A 6.0% cap rate means a buyer pays about $16.67 for each dollar of annual income; at a 5.0% cap the same dollar of annual income costs $20. Lower cap rate, more expensive income. That is the entire trick, and a downloadable version with a sensitivity grid accompanies this article for anyone who wants to push the numbers around themselves.
On its face, the cap rate measures is the unlevered current yield: the return an all-cash buyer would earn in year one if nothing changed. What’s missing, therefore: financing, income growth, capital needs, and everything that happens after year one (which is often the critical period of business plan execution). The going-in cap rate is a useful input when compared to benchmarks within the market, submarket, or asset class. It is not sufficient, however, for assessing the return potential or underwriting rigor of the investment, through exit.
What Is an Exit Cap Rate? How the Terminal Cap Rate Prices the Sale
An exit cap rate, also called a terminal or reversion cap rate, is the cap rate a sponsor assumes a buyer will pay when a property is sold at the end of the hold. It converts projected net operating income into a projected sale price:
Projected sale price = NOI for the year after the sale ÷ exit cap rate
The going-in cap rate is observed at purchase. The exit cap rate is an assumption, and on a typical four- to five-year value-add hold, it sets a large share of the projected return.
Every multifamily or commercial real estate pro forma with a projected sale contains a cell, usually unremarked, labeled something like terminal cap rate or exit cap or capitalization rate at disposition (if you’re not into the whole brevity thing). It is the cap rate the sponsor assumes a future buyer will pay for the property's future NOI. The projected sale price, and with it a large share of the projected IRR, is that future income divided by that assumed rate. Exit cap rate therefore projects the impact of the GP’s business plan (how much value was created, how rental income was improved vs. cost, etc.) as well as exogenous factors like capital markets dynamics and supply and demand within the local market, specific to the type of asset.
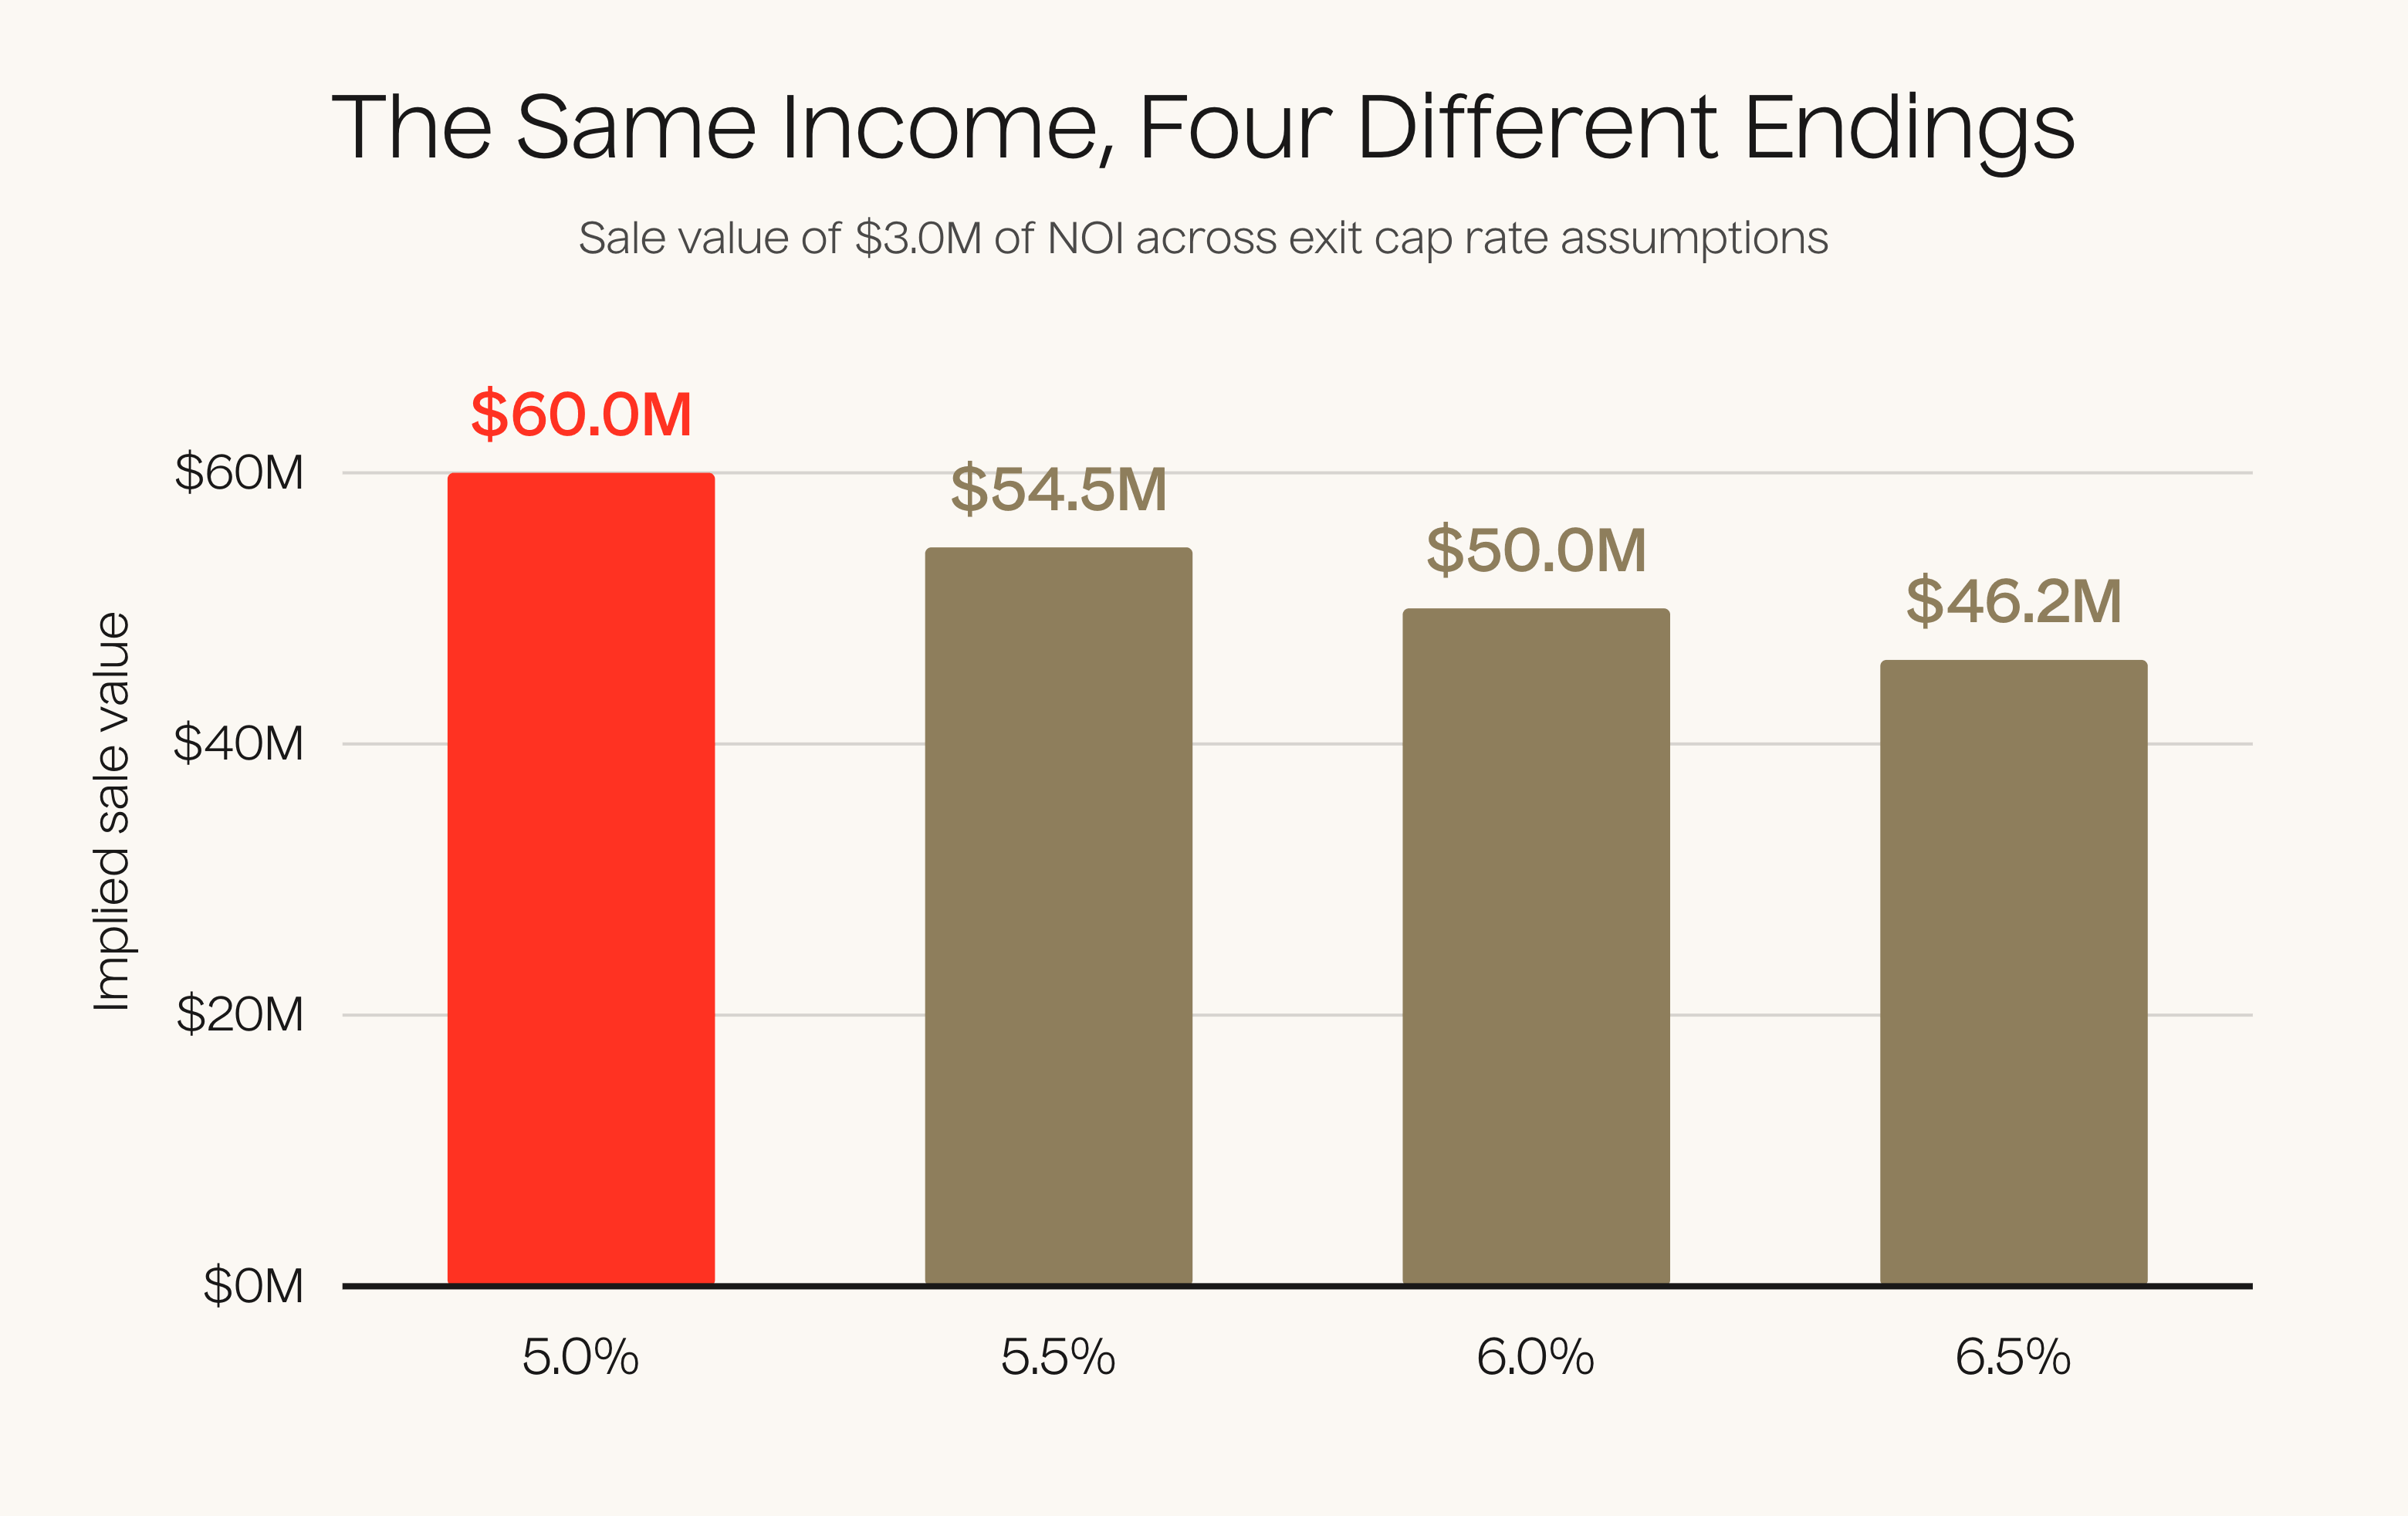
This projected figure deserves more attention than it may get, because small movements in it can yield large movements in value and projected IRR. Capitalize $3.0 million of NOI at a 5.0% exit cap and the building sells for $60.0 million. At 6.0%, $50.0 million. At 6.5%, about $46.2 million. Same building, same income, and nearly $14 million of value separates the friendliest assumption from the least friendly one.
Going-In vs. Exit Cap Rate: Reading the Sponsor's Assumption
This is why the direction of the exit-cap assumption, relative to the going-in cap, is one of the fastest reads on the sponsor’s underwriting style. A deal bought at a 6.0% cap and underwritten to exit at 5.0% embeds a bet that the market will pay significantly more for income at sale than it pays today. If that repricing arrives, wonderful; if not, the return is heavily predicated on an assumption. This does not necessarily mean projecting “cap rate compression” is wrong. If the business plan involves a substantial value-add component (like adding a gym and other common area amenities) or a full-on repositioning of the asset, forecasting a lower exit cap may be justified. If not, the assumption may be overly reliant on things beyond the sponsor’s control, like cost of capital or demand drivers in the local market.
A deal underwritten to exit at 6.25% against a 6.0% going-in makes the opposite claim: the return must come from growing the income, because the model concedes the market may pay slightly less. Conservative underwriting typically assumes an exit cap at or modestly above the going-in cap, often by 25 to 50 basis points, precisely so the business plan cannot lean on a kindness the future never promised.

An LP stress-testing an aggressive exit cap can do it with the same middle-school division: re-run the sale at the going-in cap and at 50 basis points above it, and see whether the deal still clears its return targets. If the answer is no, the investment thesis is a market-timing thesis, irrespective of how the investment materials may characterize the deal.
What Is the Cap Rate Spread? Cap Rates vs. the 10-Year Treasury
The cap rate spread is the difference between a property's cap rate and the yield on the 10-year U.S. Treasury, usually quoted in basis points. It is the second number a cap rate calculator will not surface. A Treasury is the “risk-free alternative” – passive alternative income with no tenants, no roofs, and no calls at midnight. The extra yield a property pays over that risk-free rate is the market's compensation for illiquidity, operating risk, and the possibility that the pro forma is off the mark.
Cap Rate Compression and Expansion
Cap rate compression means cap rates are falling, so buyers pay more for each dollar of income and property values rise even if net operating income stays flat. Cap rate expansion is the reverse. The same $3.0 million of NOI is worth $50.0 million at a 6.0% cap rate, $60.0 million if cap rates compress to 5.0%, and about $46.2 million if they expand to 6.5%.
Compression tends to come when the spread narrows: investors accept less premium over Treasuries and bid property prices up. A sponsor who underwrites an exit cap rate below the going-in rate is projecting compression. One who underwrites above it is allowing for expansion.
The spread is a cycle signal. When it is wide by historical standards, investors are being paid generously to take real estate risk. When it compresses toward zero, property income is priced nearly as richly as government income, and buyers are implicitly counting on rent growth or further repricing to justify the trade. In the compressed years of the last cycle, some multifamily traded through the 10-year, a negative spread, and those vintages met the rate reset of 2022 with little cushion. You can get a fairly generalized view on spreads through publicly available information: The Federal Reserve publishes Treasury yields daily, and surveys such as CBRE's quarterly cap rate survey publish where properties are trading. Again, middle school math.
A related spread matters just as much in a levered deal: the gap between the cap rate and the cost of debt. When a property yields less than its mortgage costs, each borrowed dollar dilutes the return, a condition known as negative leverage, and the deal only works if income growth outruns the drag.
Where the Cap Rate Spread Misleads
The spread is a useful signal, with three major caveats to consider:
- Cap rates are reported with a lag; they come from closed transactions and appraisals, so a published survey describes the market of a quarter or two ago, while the Treasury yield describes this morning. In fast-moving rate environments the spread can look artificially thin or wide simply because its two halves are timestamped differently.
- There is no single "cap rate": a stabilized Class A tower in Austin and a workforce garden-style property in Grand Rapids trade at different rates for good reasons, and a national average blends them into a number no actual building trades at.
- The cap rate is only as reliable as the NOI beneath it, and NOI definitions vary from deck to deck. Don’t put full weight on the cap rate before understanding all cost and income line items, and getting comfortable with the sponsor’s characterization of NOI.
How Lightstone Underwrites Exit Cap Rates
Lightstone has bought and sold through multiple rate regimes across nearly four decades, and the exits in its realized track record were underwritten before anyone knew where the 10-year would sit at sale.
As with many other components of underwriting, Lightstone’s assessment of cap rate dynamics considers the “worst-case scenario.” We operate under the assumption that the exit environment will be no friendlier than the present one, and build the return most significantly from basis and income instead.
Exit Cap and Cap Rate Spread: What LPs Should Check
Cap rates are simple and concrete at a glance, but highly fluid and nuanced upon closer examination. The return on a private real estate deal is mostly written in two numbers that evade a simple cap rate calculator — the cap rate a future buyer will pay, and the premium today's buyer collects over doing nothing at all.
These dynamics matter enormously for the total return potential of a real estate transaction, and individual LPs are best served by scrutinizing the assumptions baked in.

Soren Godbersen
Soren Godbersen is Chief Growth Officer at Lightstone DIRECT, where he oversees investor experience, day-to-day operations, marketing, and strategic direction of the group. Previously Godbersen was Chief Growth Officer at EquityMultiple, a category-defining real estate investment platform for accredited investors where he led the Marketing and Investor Relations Teams, helping to grow the firm’s AUM to nearly $1B, and investor network to over 5,000 individual high-net-worth investors. Godbersen holds a Bachelor's of Arts in Economics with Honors from Whitman College.
What is cap rate compression?

Cap rate compression means cap rates are falling, so buyers pay more for each dollar of income and property values rise even if net operating income stays flat. Cap rate expansion is the reverse. At a 6.0% cap rate, $3.0 million of NOI is worth $50.0 million; at 5.0% it is worth $60.0 million, and at 6.5% about $46.2 million.
What is a cap rate spread?
The cap rate spread is the difference between a property's cap rate and the yield on the 10-year U.S. Treasury, usually quoted in basis points. It measures the extra yield investors earn for taking on real estate's illiquidity and operating risk instead of holding a risk-free government bond.
Should the exit cap rate be higher than the going-in cap rate?
Conservative underwriting typically assumes an exit cap rate at or modestly above the going-in cap rate, often by 25 to 50 basis points, so the projected return depends on growing income rather than on buyers paying more for that income at sale. An exit cap rate below the going-in rate assumes the market will reprice in the seller's favor.
How do you calculate sale price with an exit cap rate?
Divide the net operating income projected for the year after the sale by the exit cap rate. At a 6.0% exit cap rate, $3.0 million of NOI implies a $50.0 million sale price; at 5.0%, $60.0 million; at 6.5%, about $46.2 million. Small changes in the exit cap rate move the projected sale price significantly.
What is an exit cap rate?
An exit cap rate, also called a terminal or reversion cap rate, is the cap rate a sponsor assumes a buyer will pay when a property is sold at the end of the hold. It converts projected net operating income into a projected sale price, so it sets a large share of the projected return on a typical four- to five-year value-add investment.